

Part 2: Deep dive on Block ($SQ)
Part 2: Deep dive on Block ($SQ)

In addition to my Substack newsletters, I also run a Stocktwits room where I post my current holdings, daily activity, investment models, technical analysis, live charting, live trading and market commentary for both my Investment Portfolio (long term, strong fundamentals, 20-30 holdings) and my Trading Portfolio (short term, strong technicals, 10-20 holdings). The two options are $15/month for the monthly plan [click here] and $150/year for the annual plan [click here]. Prices for both plans are going up in two weeks so this is a great time to lock in the current rates.
You can now signup for my new Substack called Jonah’s Trading Charts which is focused exclusively on technicals/charts and great trading/breakout setups. Every morning I do a live charting session at 5:30am and then send out an email with my 10-20 favorite trading charts/setups for the day. You’ll also have access to my current trading portfolio with current positions/sizes, entry/exit prices and gains/losses/win rate. I also do live charting/trading sessions most days at 10-11am and 3-4pm.
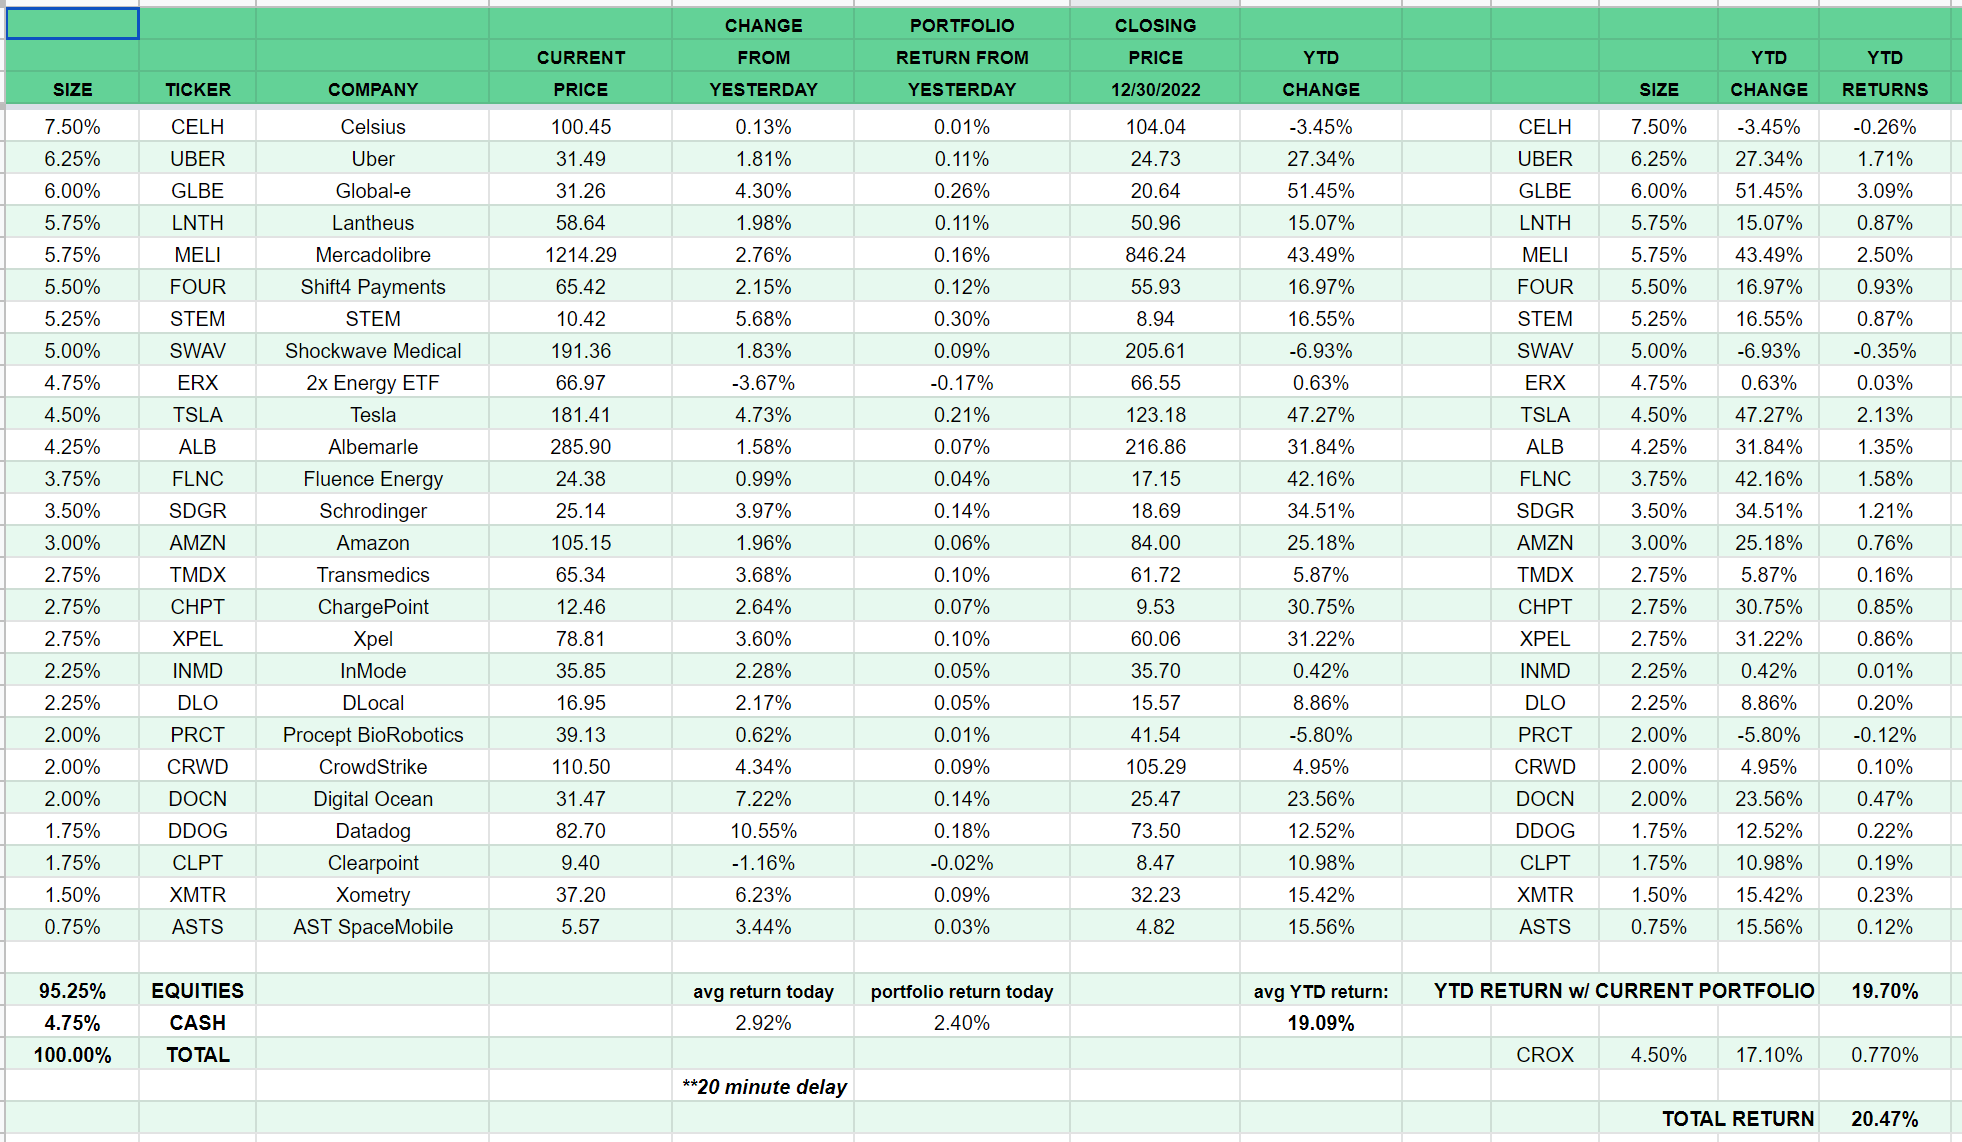
Here is my current investment portfolio, going forward I’ll keep it behind the paywall for paid subscribers only.
Company: Block (formerly Square)
Ticker: (SQ)
Website: Block.xyz and Square.com
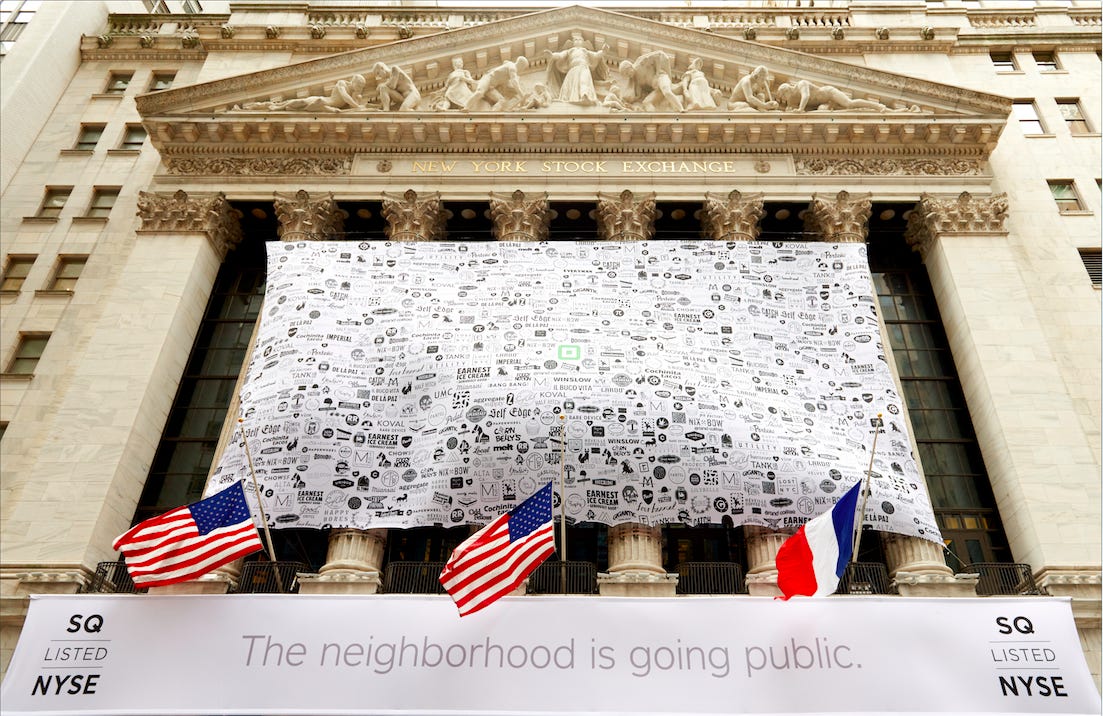
IPO date: November 19, 2015
IPO price: $9.00
Current stock price: $83.90
Outstanding shares: 600.1 million
52 week high: $149.00 on March 29, 2022
52 week low: $51.34 on November 03, 2022
All time high: $289.23 on August 05, 2021
Market cap: $50.348 billion
Net cash/debt: -$165 million
Enterprise value: $50.513 billion
Headquarters: San Francisco, California, United States
Number of employees: 14,000+
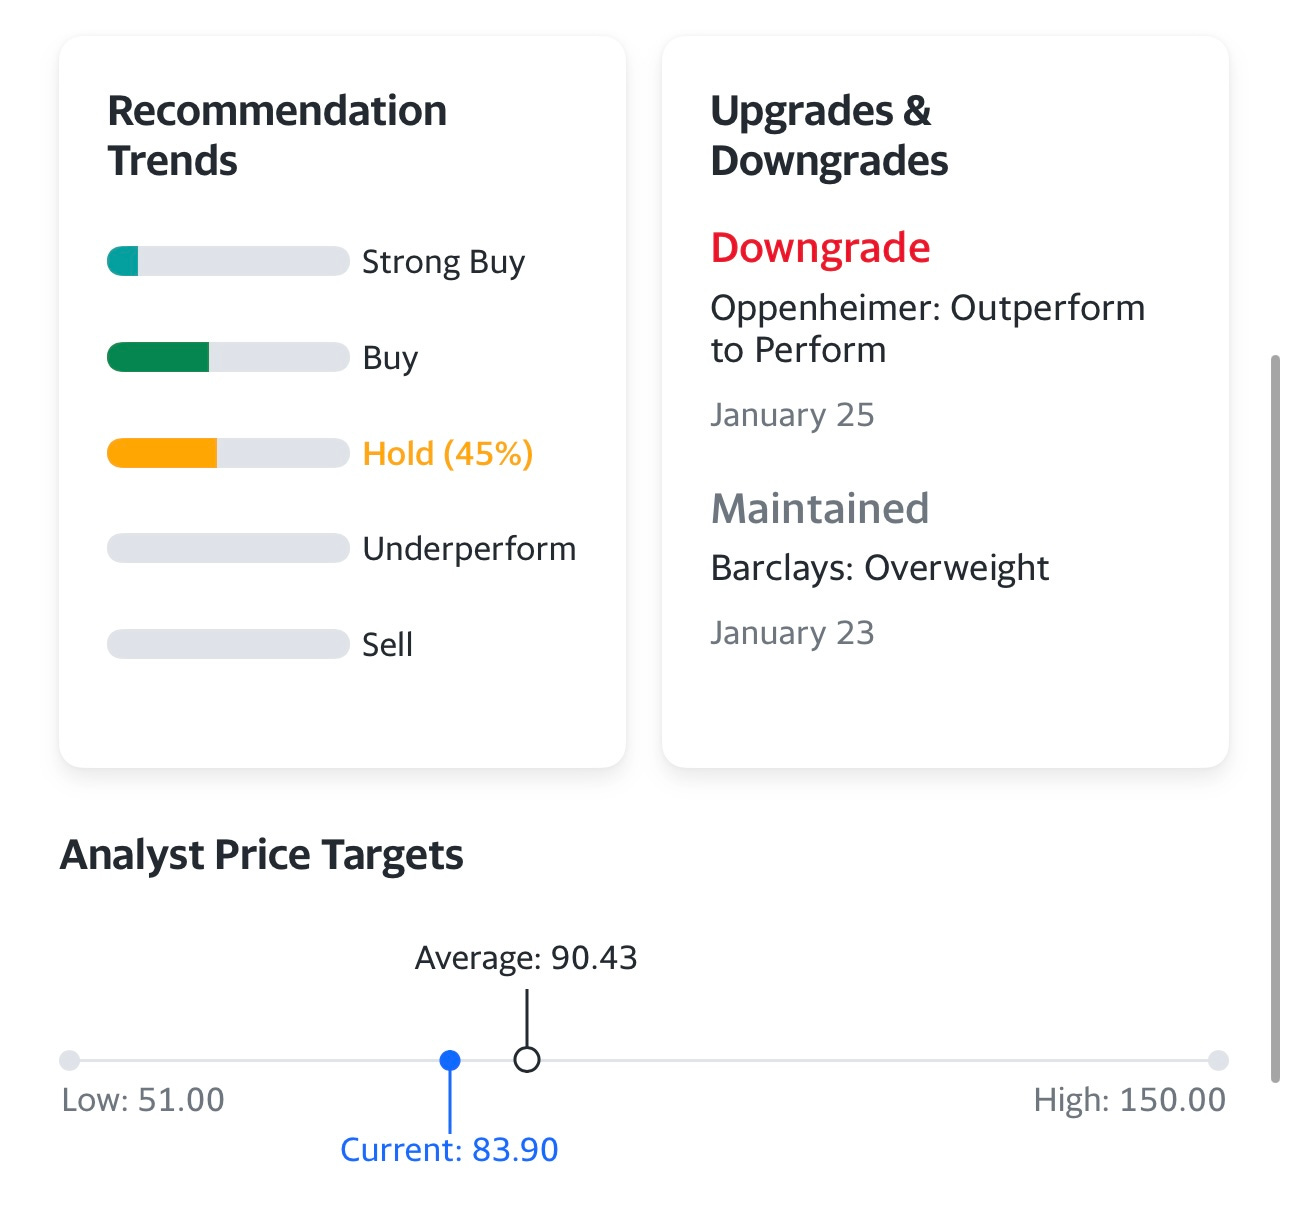
Average price target from analysts: $90.43
Investor Relations [click here]
Q3 2022 Shareholder Letter [click here]
Q3 2022 Earnings Call [click here]
Block Investor Day 2022 [click here]
Next earnings date/call for Q4 2022 is February 23, 2022
Outline
Introduction [Part 1]
Company Background [Part 1]
Opportunity [Part 1]
Technology [Part 1]
Business Model [Part 1]
Customers [Part 1]
Competitive Advantages [Part 1]
Management [Part 2]
Culture [Part 2]
Financials [Part 2]
Risks [Part 2]
Ownership [Part 2]
Valuation [Part 2]
Investment Model [Part 2]
Analysts [Part 2]
Technicals [Part 2]
Conclusion [Part 2]
Here’s the Part 1 writeup from a few days ago, we left off after Competitive Advantages…

Management
Block is still a founder-led company, with Jack Dorsey at the helm of the entire organization, while Jim McKelvey sits on the board of directors with no operating position in the business.
Dorsey is widely regarded as a visionary and innovative leader driven by the mission of his company. He is considered one of the most influential figures in the tech industry.
Dorsey remains the largest insider shareholder in Block, cumulatively owning about 6% of the company. He has no cash or equity compensation except an annual base salary of $2.75 (two dollars and seventy-five cents).
Dorsey's financial incentives are strongly aligned with the interests of long-term stockholders.
A while before Twitter was bought by Elon Musk and taken private, Dorsey exited his role as a CEO to fully concentrate on Block.
The management team at Block includes several experienced executives from various industries, including finance, technology, and retail. Most executives have been with the company for more than 5 years.
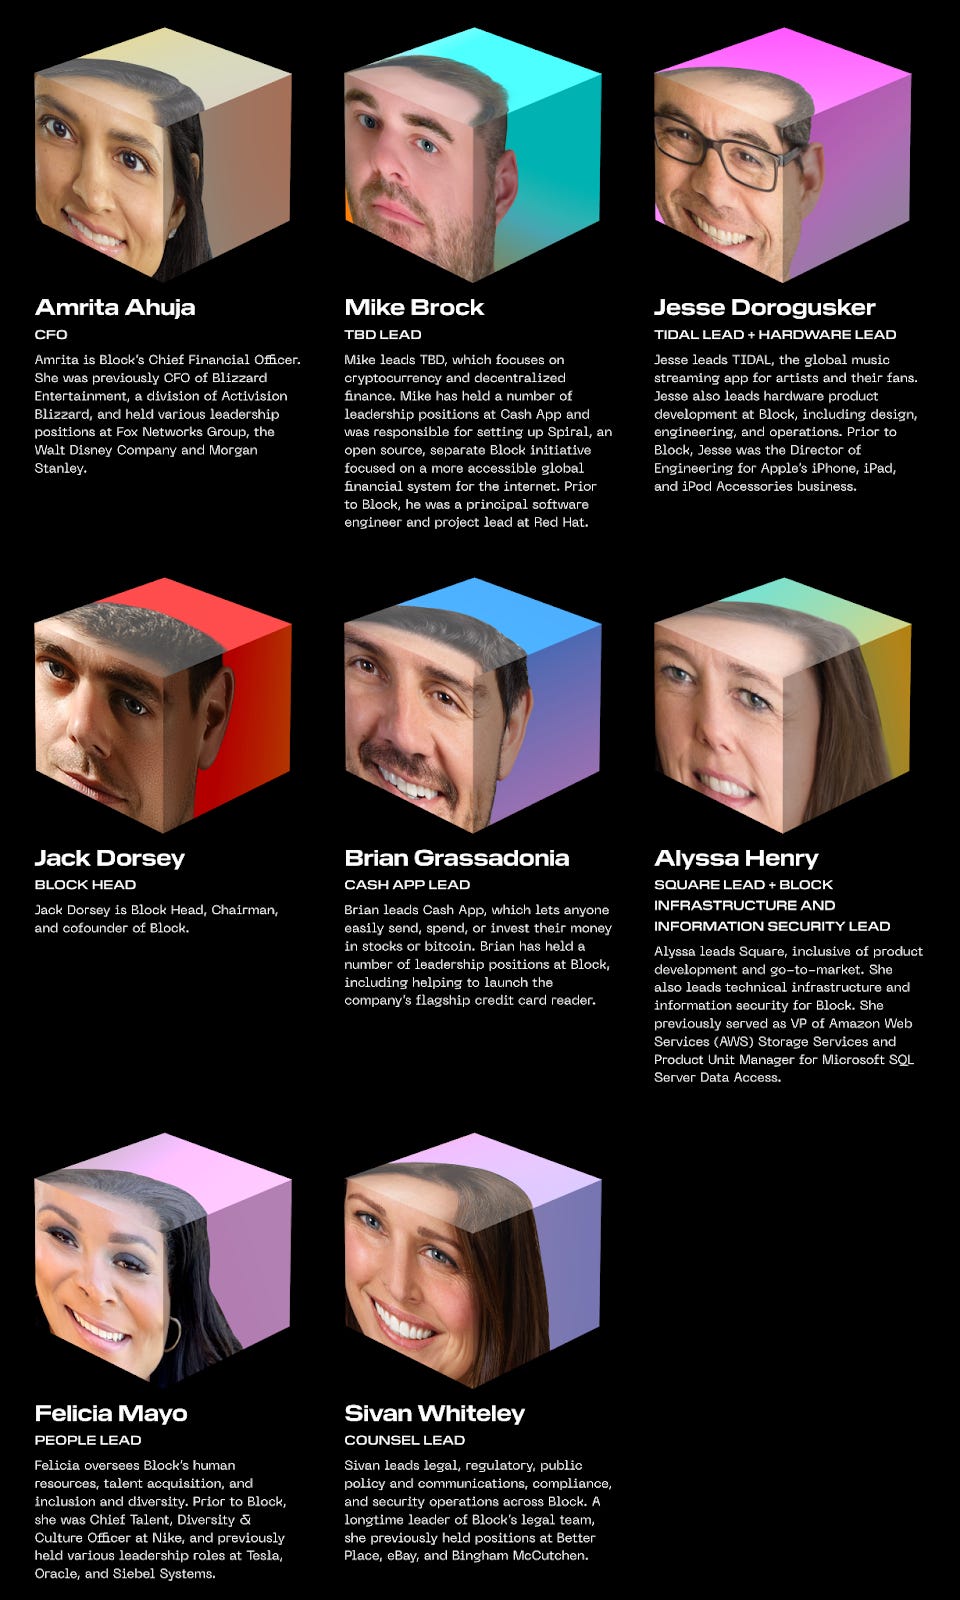
Some key executives:
Amrita Ahuja is the Chief Financial Officer. She joined Block in 2018 and has over 20 years of experience in finance, including senior roles at several investment banks and technology companies. She was a CFO of Blizzard Entertainment (Activision Blizzard), and held various leadership positions at Fox Networks Group, the Walt Disney Company, and Morgan Stanley.
Brian Grassadonia is the Cash App Lead. He joined Block in 2010 as the first Product Manager at Square, and since 2013 he has been leading Cash App across product, engineering, design, operations, machine learning, marketing, and brand, as well as managing the business’s holistic P&L.
Alyssa Henry is the Square Lead / Block Infrastructure and Security Lead. She joined Block in 2014 from Amazon, where she was a VP of AWS Storage Services. Alyssa now leads Square, including product development and go-to-market.
All executives get a base salary ($500,000 annually), some equity compensation through a mix of stock options and restricted stock-based awards, and no special retirement, health, or welfare benefits, as well as other benefits.
Each Block's ecosystem operates independently, making holistic decisions around their teams, roadmaps, strategy, and investments.
Block has a superstar board of directors which includes Roelof Botha (Sequoia Capital and ex-CFO at PayPal), Mary Meeker (general partner at BOND, previously Kleiner Perkins' Digital Growth Fund), Larry Summers (former Secretary of the US Treasury, the Charles W. Eliot University Professor and President Emeritus of Harvard University), Randy Garutti (CEO of Shake Shack), Shawn "JAY-Z" Carter (former owner of TIDAL), among a few others.
Culture
Mission: to help sellers, individuals, artists, fans, developers, and all the people in between to overcome barriers to access the economy.
Square helps sellers more easily run and grow their businesses with its integrated ecosystem of commerce solutions, business software, and banking services.
Cash App is focused on redefining the world’s relationship with money by making it more relatable, instantly available, and universally accessible.
TIDAL is a global platform for musicians and their fans that uses unique content, experiences, and services to bring fans closer to the artists they love and give artists the tools to succeed as entrepreneurs.
Spiral builds and funds free, open-source projects that advance the use of Bitcoin as a tool for economic empowerment.
TBD is building an open developer platform to make it easier to access Bitcoin and other blockchain technologies without having to go through an institution.
The company is building an inclusive financial system in which people have equal access to opportunity regardless of their race, gender, sexual orientation, or other differences. The team lives by these same values when building its workplace and also takes a data-driven approach to make this work.
Headquartered in San Francisco, California, United States, Block has multiple offices across the world, including Canada, Australia, Europe (the United Kingdom, Germany, Spain, Ireland, and Norway), Japan, and Mexico.
The company supports distributed work that allows employees to work from home or from a Block office space.
According to LinkedIn, the company employs over 14,000 people across all of its ecosystems.
Block did not announce any layoffs so far, but the management indicated in the latest earnings call that the company will slow down the pace of hiring more people.
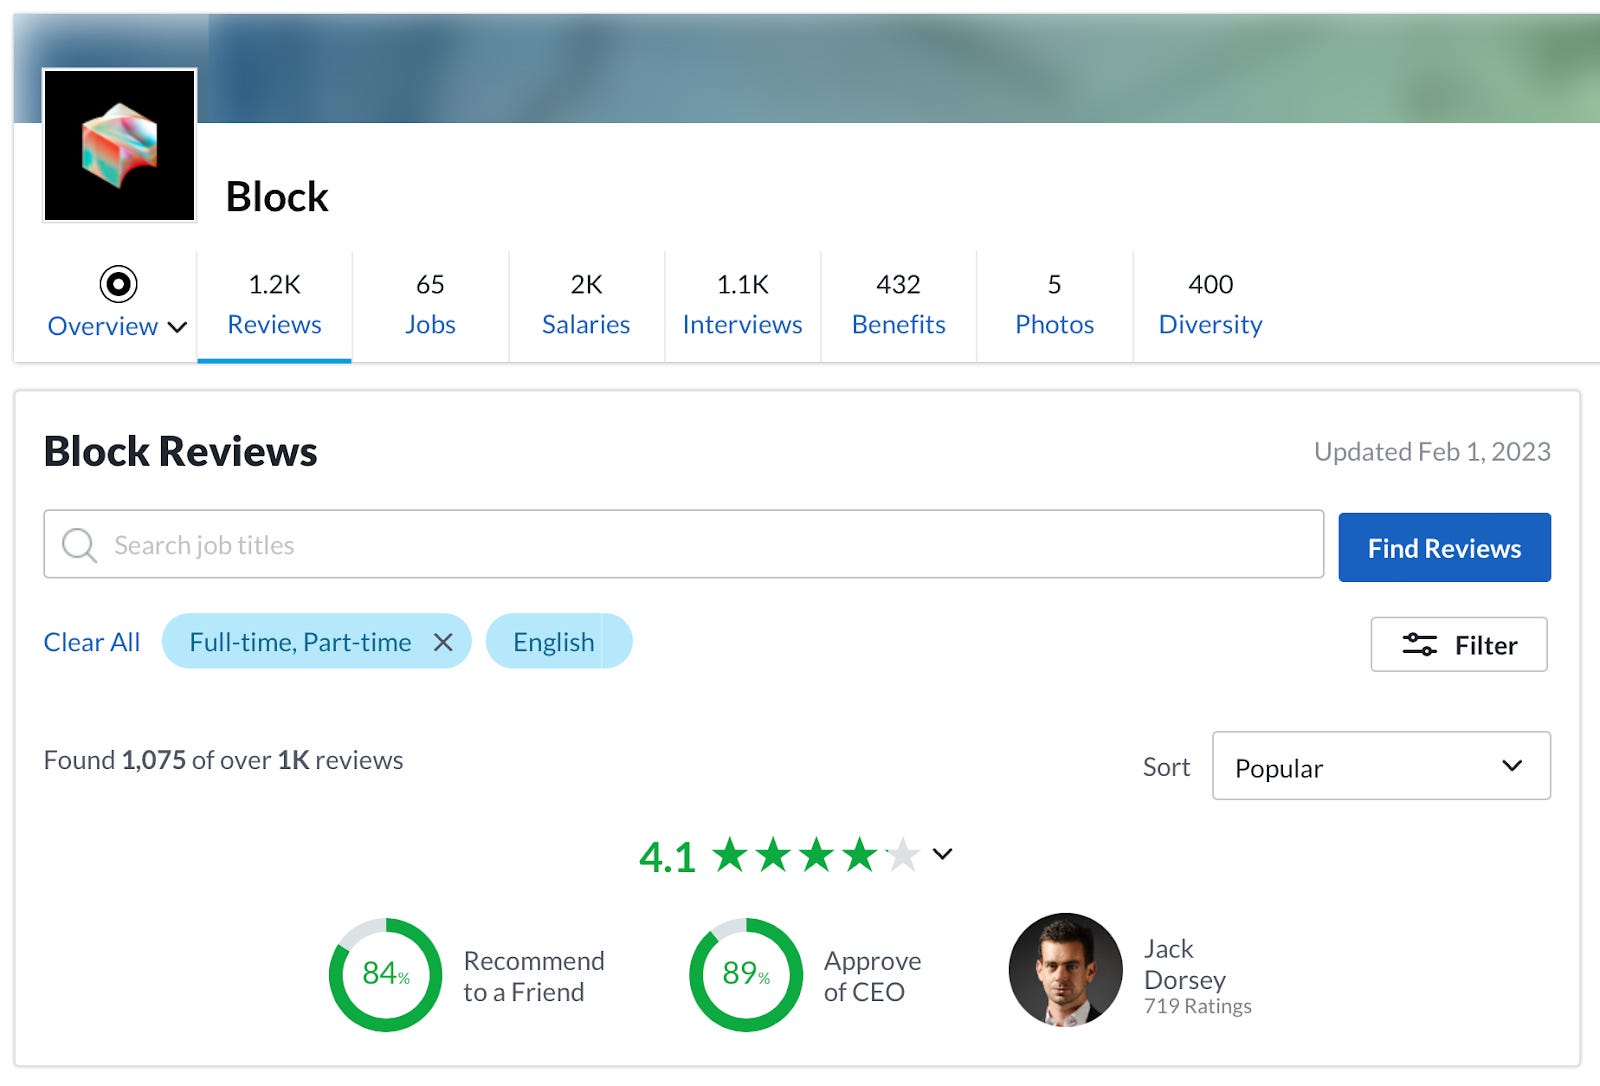
Employees rate Block pretty high. The company has a solid 4.1 / 5 rating based on over 1,000 reviews on Glassdoor. 84% of employees would recommend a company to a friend, while Jack Dorsey has an 89% CEO approval rating (based on 719 ratings).
The majority of Block employees have positive views of the company and its leadership, and many of them highlight the company's innovative culture and attention to employee development.
Financials
Revenue
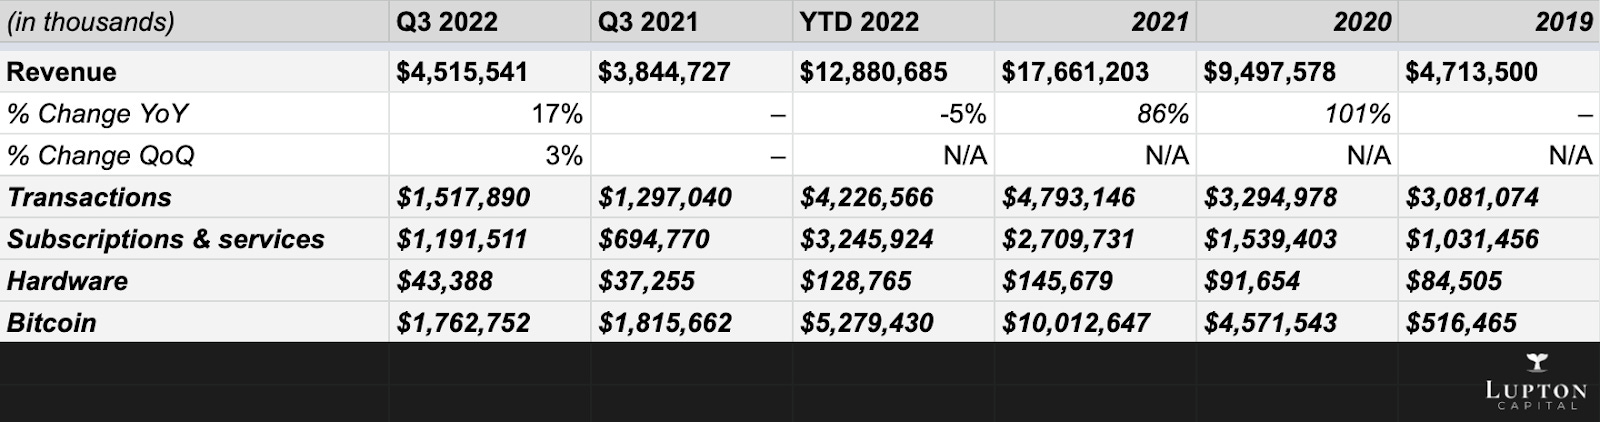
Q3 2022
$4.5 billion (+17% YoY and 3% sequentially)
Cash App generated $2.68 billion in revenue, including $1.76 billion of Bitcoin revenue
Square generated $1.77 billion in revenue
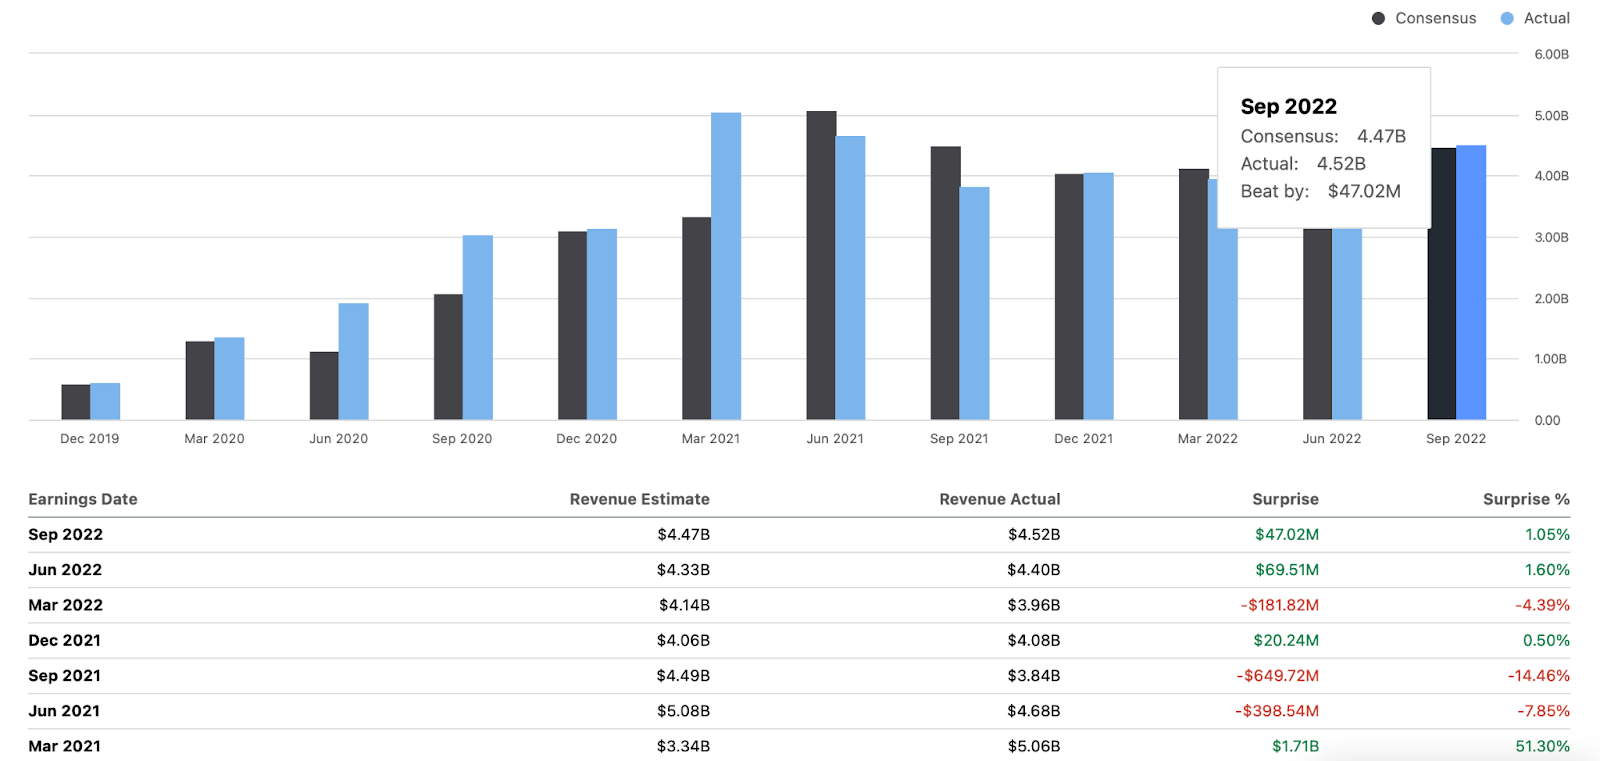
Analysts' consensus was $4.47 billion (beat by $47 million or 1.05%)
YTD 2022
$12.8 billion (-5% YoY)
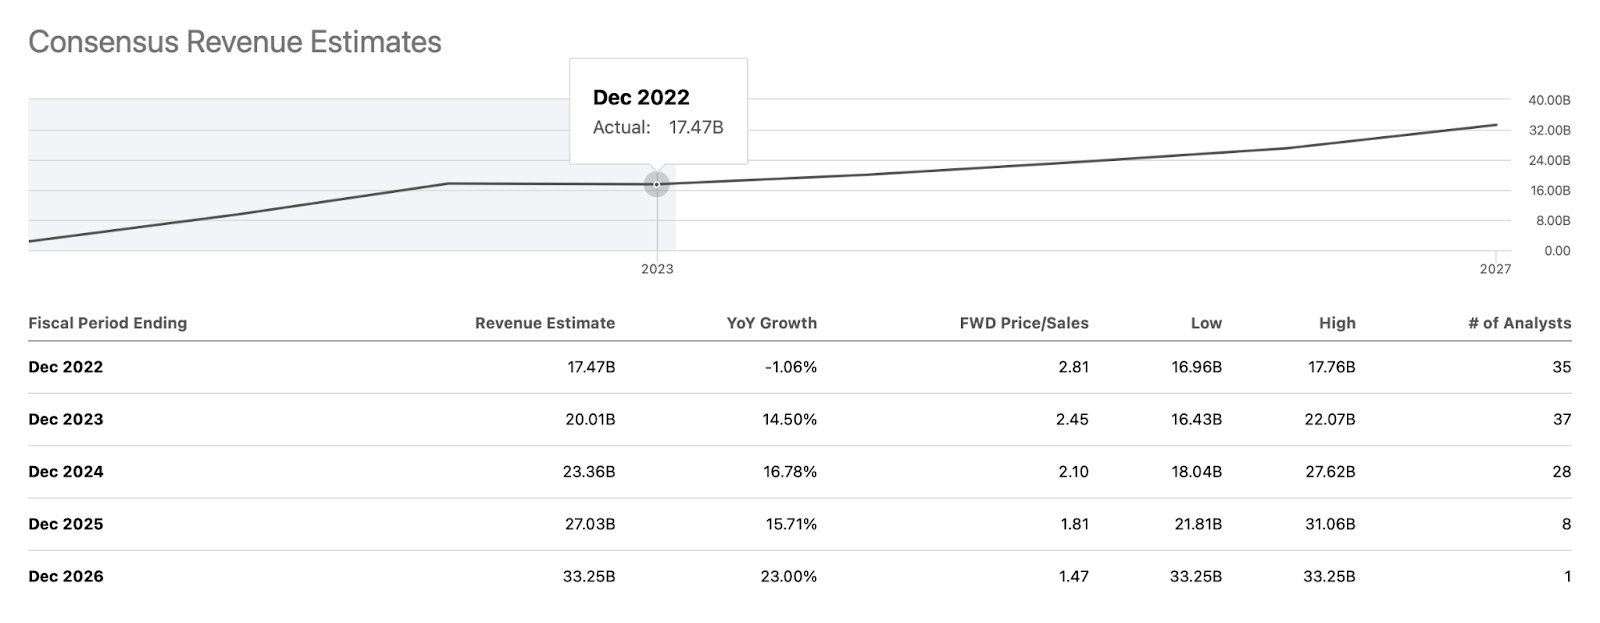
Analysts' consensus for FY2022 is $17.47 billion (-1.06% YoY)
Previous years
$17.6 billion in 2021 (+86% YoY)
$9.4 billion in 2020 (+101% YoY)
$4.7 billion in 2019 (N/A)
Gross Profit & Margin
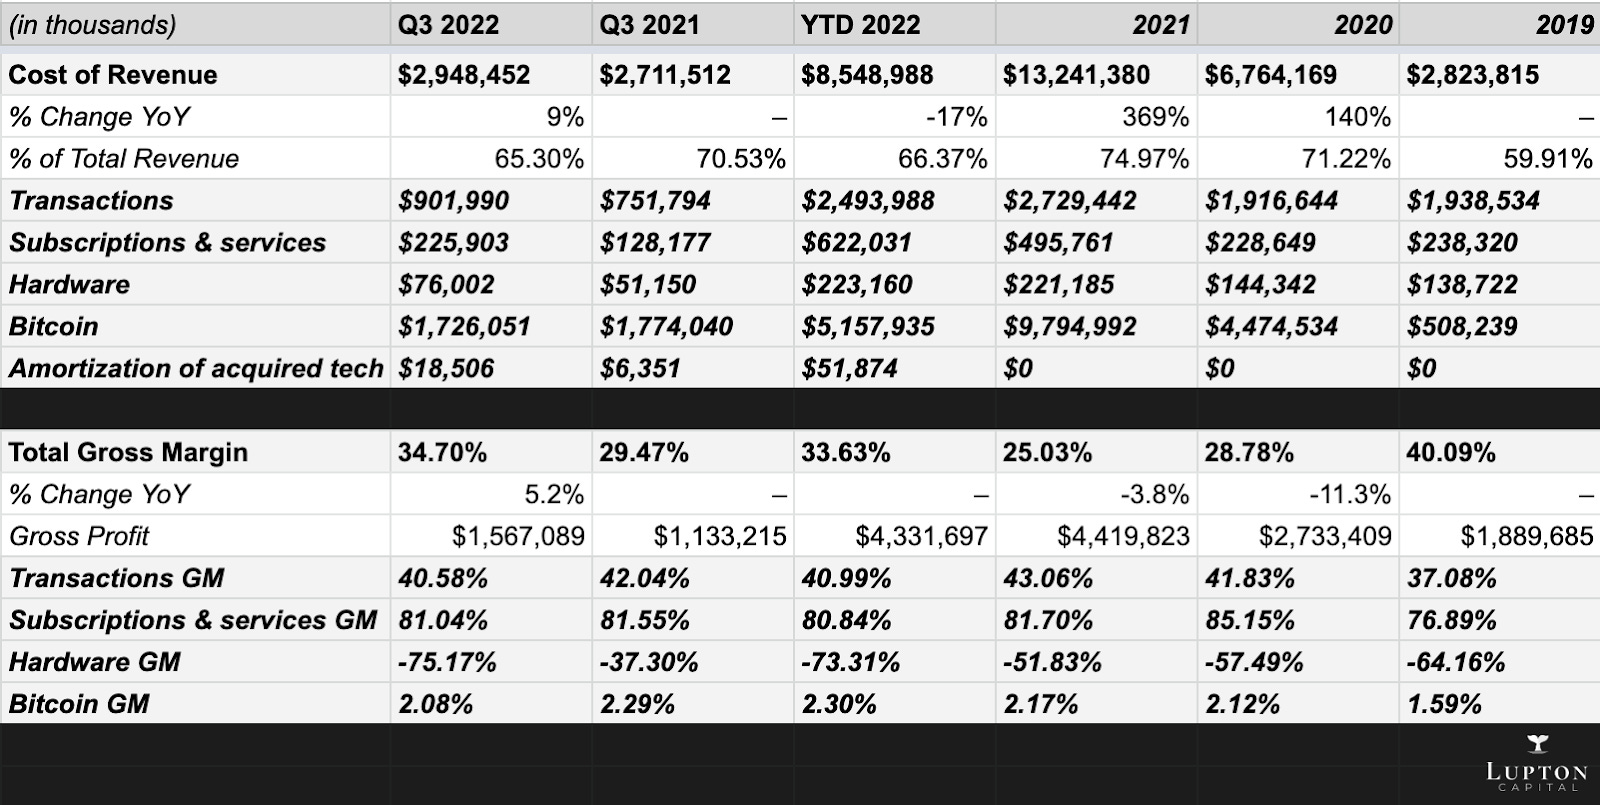
Q3 2022
Gross profit $1.56 billion (+38% YoY and +46% on a three-year CAGR basis due to strong growth across main ecosystems)
Afterpay contributed $150 million of gross profit
Cash App generated $774 million of gross profit (+51% YoY and +84% on a three-year CAGR basis)
Square generated $783 million of gross profit (+29% YoY and +29% on a three-year CAGR basis)
Total gross margin 34.70% vs. 29.47% in Q3 2021
YTD 2022
Gross profit $4.33 billion
Total gross margin 33.63%
Previous years
Gross profit $4.41 billion and gross margin 25.03% in 2021
Gross profit $2.73 billion and gross margin 28.78% in 2020
Gross profit $1.88 billion and gross margin 40.09% in 2019
Profitability
Refer to the Business Model section
Q3 2022
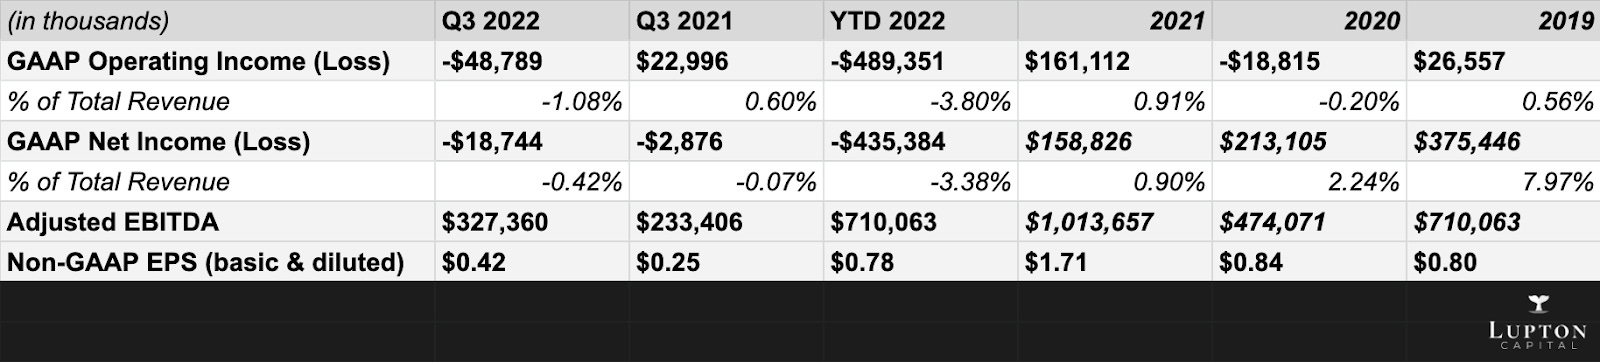
GAAP Operating Loss $48.7 million vs. Operating Income $22.9 million in Q3 2021
GAAP Net Loss $18.7 million vs. Net Loss $2.8 million in Q3 2021
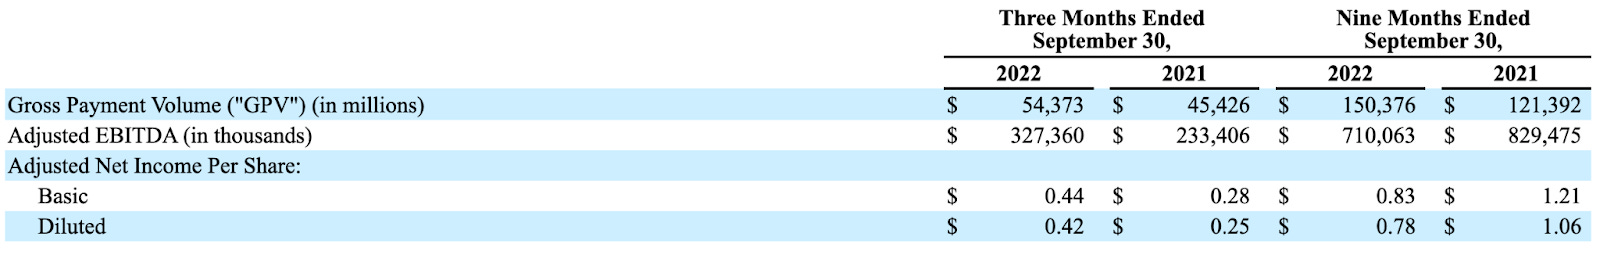
Adjusted EBITDA (excludes stock-based compensation and amortization of intangible assets) $327.3 million vs. $233.4 million in Q3 2021
Adjusted EPS $0.42 ($0.23 consensus) vs. $0.18 in Q2 2022 and $0.25 in Q3 2021
YTD 2022
GAAP Operating Loss $489.7 million
GAAP Net Loss $435.3 million
Adjusted EBITDA $710 million
Previous years
GAAP Operating Income $161.1 million, GAAP Net Income $158.8 million, and Adjusted EBITDA $1.03 billion in 2021
GAAP Operating Loss $18.8 million, GAAP Net Income $213.1 million, and Adjusted EBITDA $474 million in 2020
GAAP Operating Income $26.5 million, GAAP Net Income $375.5 million, and Adjusted EBITDA $710 million in 2019
Guidance
The company did not provide any guidance for Q4 2022 and FY 2023.
"Looking ahead to 2023, we are still in the process of finalizing our plans for next year. Over the past several years, we've significantly grown our business and our expense base. Looking to 2023, we're focused on operating more efficiently, and we expect to slow our pace of expense growth meaningfully compared to prior years. Based on our preliminary plans, our outlook includes a slowdown across several areas of our discretionary expenses, a continuation of the discipline you've seen from us in recent quarters, in particular, two areas to underscore.
First, hiring. Headcount makes up the largest driver of our expense base. In 2023, we expect to significantly moderate our pace of hiring compared to recent years, which will benefit our financial results on a lag with greater leverage on headcount costs expected in the back half of 2023 and into 2024.
Second, sales and marketing. In 2023, we intend on pulling back on lower ROI, more experimental areas, including brand and awareness spend across both our Square and Cash App ecosystems, and continue investing in channels with more proven ROI.
We remain focused on balancing growth and profitability in this environment. We want to operate with efficiency and agility in 2023 and beyond with an increasing focus on not only top-line growth, but also profitability across both adjusted EBITDA and profit metrics that factor in stock-based compensation, where we intend on driving leverage over time." – from Q3 2022 earnings call.
Cash
$6.5 billion in cash, cash equivalents, restricted cash, and short-term investments
$4.1 billion long-term debt with only $460 million in short-term debt with 0.5% interest rate payable semi-annually (maturing in May 2023)
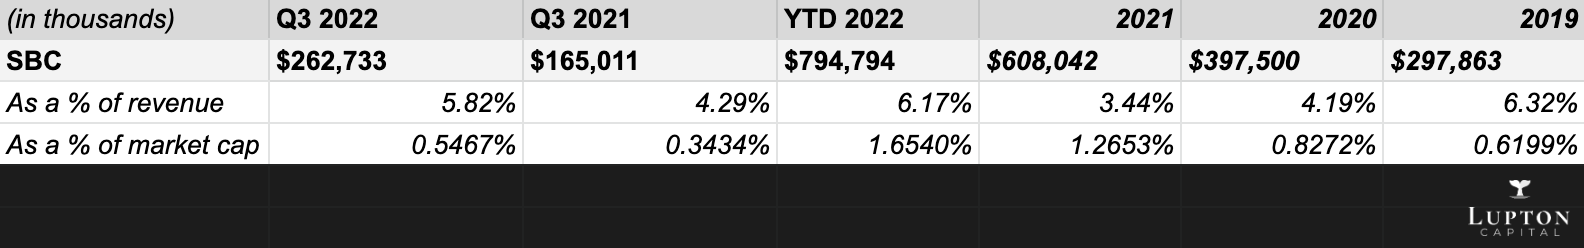
$262.7 million (5.82% of total revenue) stock-based compensation in Q3 2022 vs. $165 million (4.29% of total revenue) in Q3 2021 (+59% YoY)
$794.7 million (6.17% of total revenue) stock-based compensation YTD 2022 vs. $608 million in 2021, $397.5 million in 2020, and $297.8 million in 2019
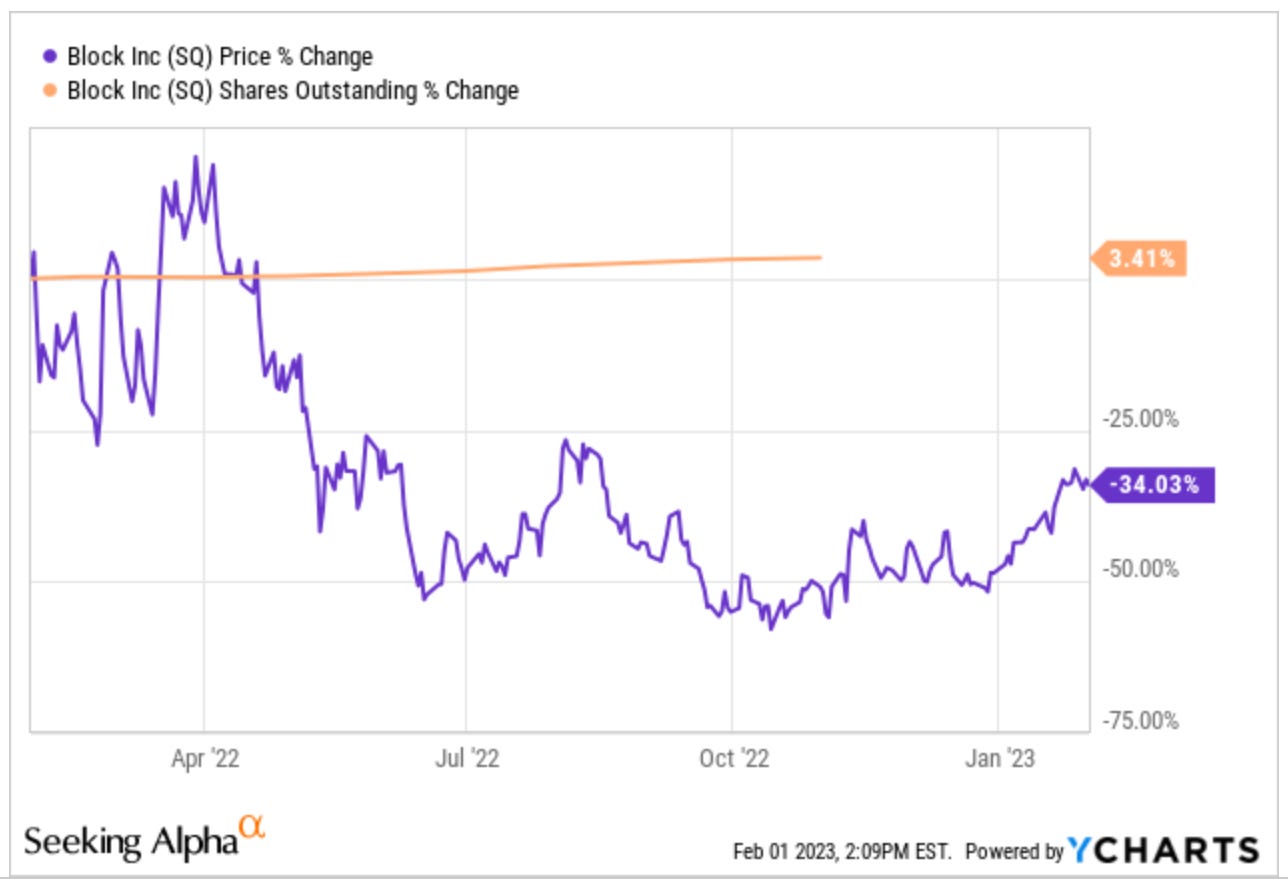
3.41% dilution in the past 12 months, while the stock price depreciated by 34%
$166 million in free cash flow YTD 2022 (1% free cash flow margin)
$713 million in free cash flow in 2021 (4% free cash flow margin)
Free cash flow positive since 2017
Key Metrics
Gross Payment Volume (GPV)
GPV is the total dollar amount of all card payments processed by sellers using Square (net of refunds and ACH transfers). Additionally, GPV includes Cash App Business GPV (Cash App activity related to peer-to-peer transactions received by business accounts, Cash App Pay, and peer-to-peer payments sent from a credit card). GPV does not include BNPL transactions.
Q3 2022 gross payment volume grew to $54.4 billion from $52.5 billion in Q2 2022 and from $45.4 billion in Q3 2021.
In Q3 2022, the company achieved positive GPV and gross profit retention for the Square business. Square GPV grew 20% YoY in the quarter. GPV from the markets outside the US grew 40% year-over-year.
Risks
Critical risks worth considering:
Competition (the company operates in highly competitive markets, where it faces intense and increasing competition – refer to the Competitive Advantages section for more information);
Recession (less spending by consumers may lead to lower payments volume for Square merchants and fewer inflows for Cash App);
Growth (Block is no longer a growth story, with projected revenue growth at a ~20% CAGR);
Global expansion (the majority of growth projected will come from the expansion to international markets, which poses plenty of additional risks, including competition, regulations, currency, and others);
Profitability (the company will end the fiscal year of 2022 unprofitable and will remain so until at least 2024);
Bitcoin (the exposure to Bitcoin and investments in various products related to it remain a risk for the company);
Afterpay (the company has overpaid for this acquisition, the risk of successfully integrating Afterpay into both Square and Cash App still persists, and there are other risks related to this specific acquisition like a loan loss risk, which will only increase in the recession environment, or regulatory scrutiny in the BNPL space in general);
Insider selling (heavy insider selling in the past 12 months with no insider purchasing, especially at these levels when the stock price is down 60%+ from the all-time highs);
Ownership
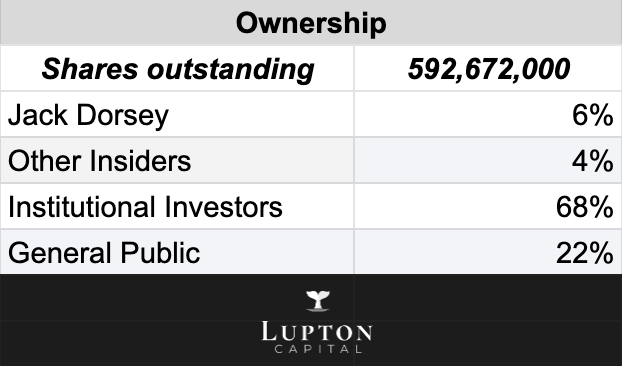
As of Q3 2022, the company had 592,672,000 shares outstanding.
Jack Dorsey remains the largest inside shareholder, owning around 6% of the company (~1,000,000 Class A common stock and 36,763,992 Class B common stock) with slightly less than 40% of total voting.
James McKelvey is the second largest shareholder (owns 2% of the company) though he no longer works in the company (serves on the board of directors).
Other insiders own approximately 2% of the company, bringing the total insider ownership to 10%.
The largest outside investors are The Vanguard Group (5.6%), BlackRock (4.1%), Morgan Stanley (3.1%), Sands Capital (2.6%), and others.
In total, institutional investors own approximately 69% of the company, while the rest is in the hands of the general public.
Insiders have been selling the shares in the past 12 months. Alyssa Henry (Square Lead) is the primary seller. She sold shares worth several million throughout 2022 and early 2023. Other executives (except Jack Dorsey) also sold shares in 2022.
No insider purchasing has ever been recorded since the company's IPO in 2015.
Valuation
As I mentioned in the introduction which was in Part 1 of this deep dive writeup, SQ’s valuation metrics have come way down over the past couple years. At the highs SQ was trading at approx 55x EV/GP and now it’s closer to 9x EV/GP, similarly SQ used to trade at more than 200x EV/EBITDA and now it’s closer to 44x EV/EBITDA. This top chart shows SQ’s financials from when they came public in late 2015 through last year and then the bottom chart shows last year (estimates) through 2026 based on the analysts estimates.
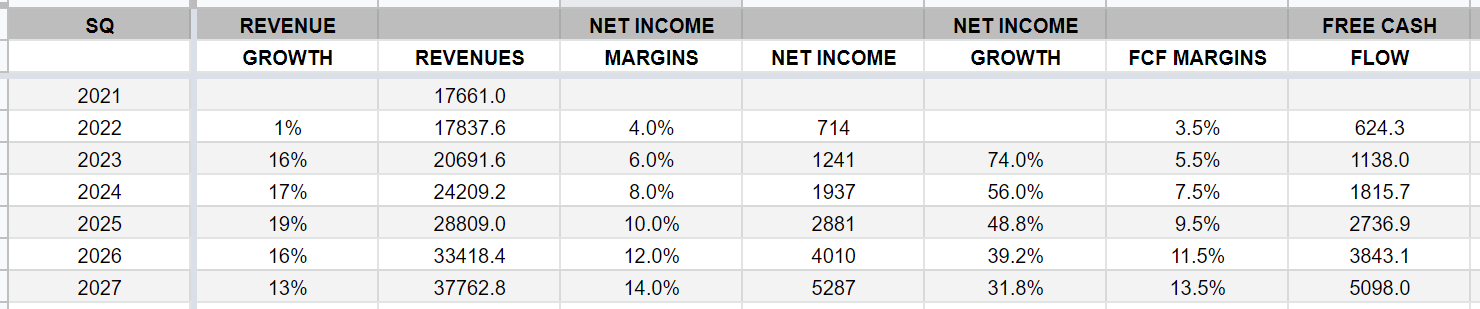
As you can see growth is expected to slow down significantly to the 15-20% range for the next 3-4 years so the upside in the stock price will need to come from margin expansion. If margins don’t expand and revenues only grow 15-20% then I think the current multiple SQ trades at would be at risk meaning the stock is still overvalued however if they can expand those net income margins from 4.5% in 2022 (estimated) to 12.3% in 2026 then you should see strong EPS growth which might lead to some multiple expansion.

Looking at the estimates for 2023, using the current enterprise value of $50.5 billion it means SQ is currently trading at 39.1x 2023 EV/EVITDA and 27.2x 2024 EV/EBITDA which seems reasonable considering that EBITDA is expected to grow at an average annual rate of 51.4% for the next few years.
If we look at net income, SQ is currently trading at 45.6x 2023 EV/NI and 30.7x 2024 EV/NI which I’d argue might be undervalued if we consider that net income is expected to grow at an average annual rate of 56.7% for the next few years. If we applied a 1.0x to 1.1x PEG ratio to this number you could justify a 62.3x multiple however I don’t think SQ deserves that yet until they prove to investors they can finally expand those net income margins.
Like most investors when talking about valuations I typically use net income or non-GAAP EPS but in the case of SQ there is clearly a huge discrepancy between GAAP and non-GAAP which is something to keep in mind. Like many software/fintech growth companies their FCF and non-GAAP numbers look way better than GAAP because of all the line items like SBC that don’t get included in non-GAAP numbers or FCF.
If you look at 2024 estimates, they’re expected to do $1.643 billion of net income with 48.4% YoY growth, if you just put a 53.2x multiple (1.1x PEG) on that net income number, add back the debt and divide by the # of shares outstanding you get approximately $140.36 per share (assuming 623.1M shares) which is ~66.4% higher from the current price. I think that’s your upside potential over the next 18-24 months assuming they hit these estimates below.

Investment Model
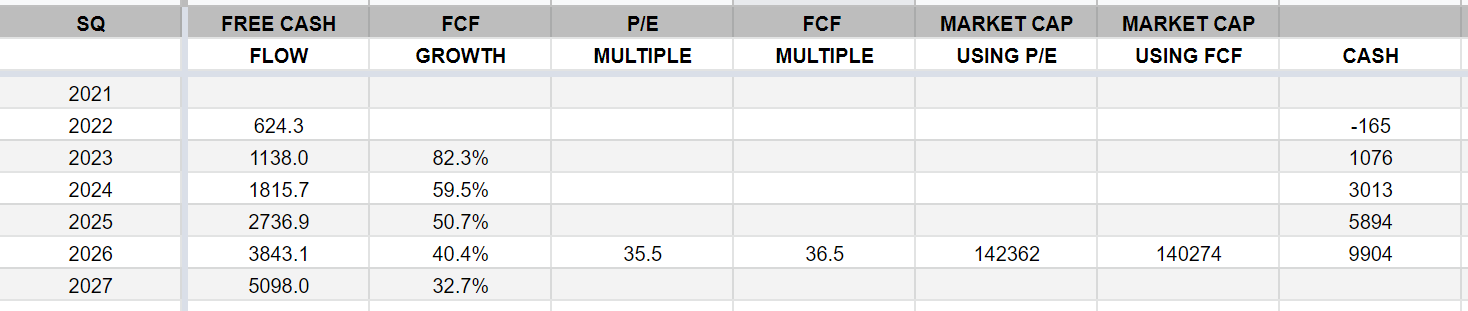
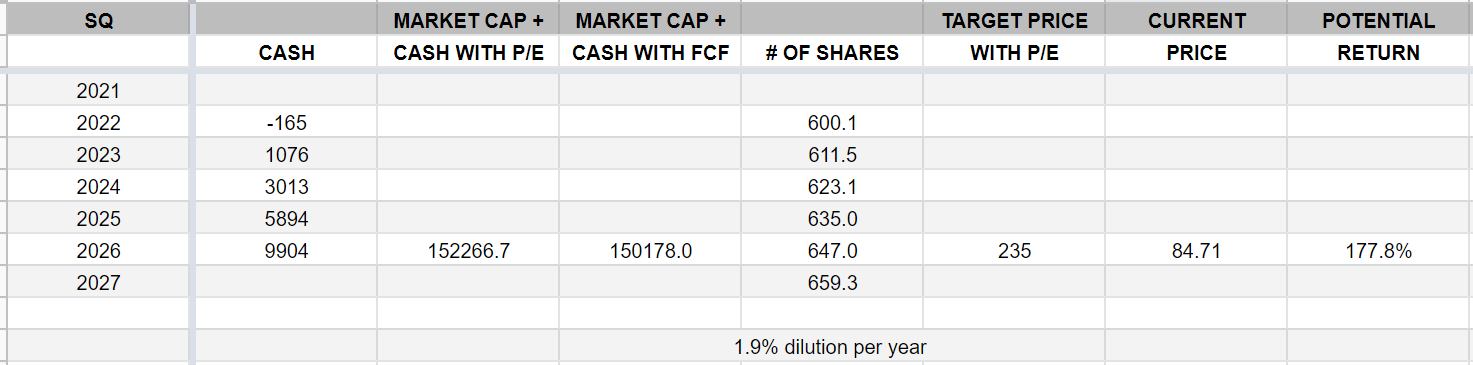
With my investment models I try to show what SQ might be worth in 3-4 years if they hit the analyst estimates for revenues, net income margins, FCF, etc.
In the case of SQ, assuming they can get to $33.4 billion of revenues in 2026 with 12% net income margins and they’re growing net income at 39.2% with 31.8% net income growth expected for the following year then a fair P/E multiple would be mid 30s so I said 35.5x, they you add in the cash balance and divide by 647 million shares (assuming SBC stays at 1.9% per year) then you end up with a $235 price target for the end of 2026 which is 177.8% higher than Friday’s closing price.
Analysts
Below is the last 75+ analyst upgrades/downgrades for SQ — if we went back farther to 2021 you’d see these same analysts with $300+ price targets and then a few months ago those price targets had been cut to $60-90 at most firms. Now that SQ has bounced more than 60% off the November lows I suspect we’ll see some of these price targets going higher in the coming weeks.
Nobody chases prices better than analysts :)
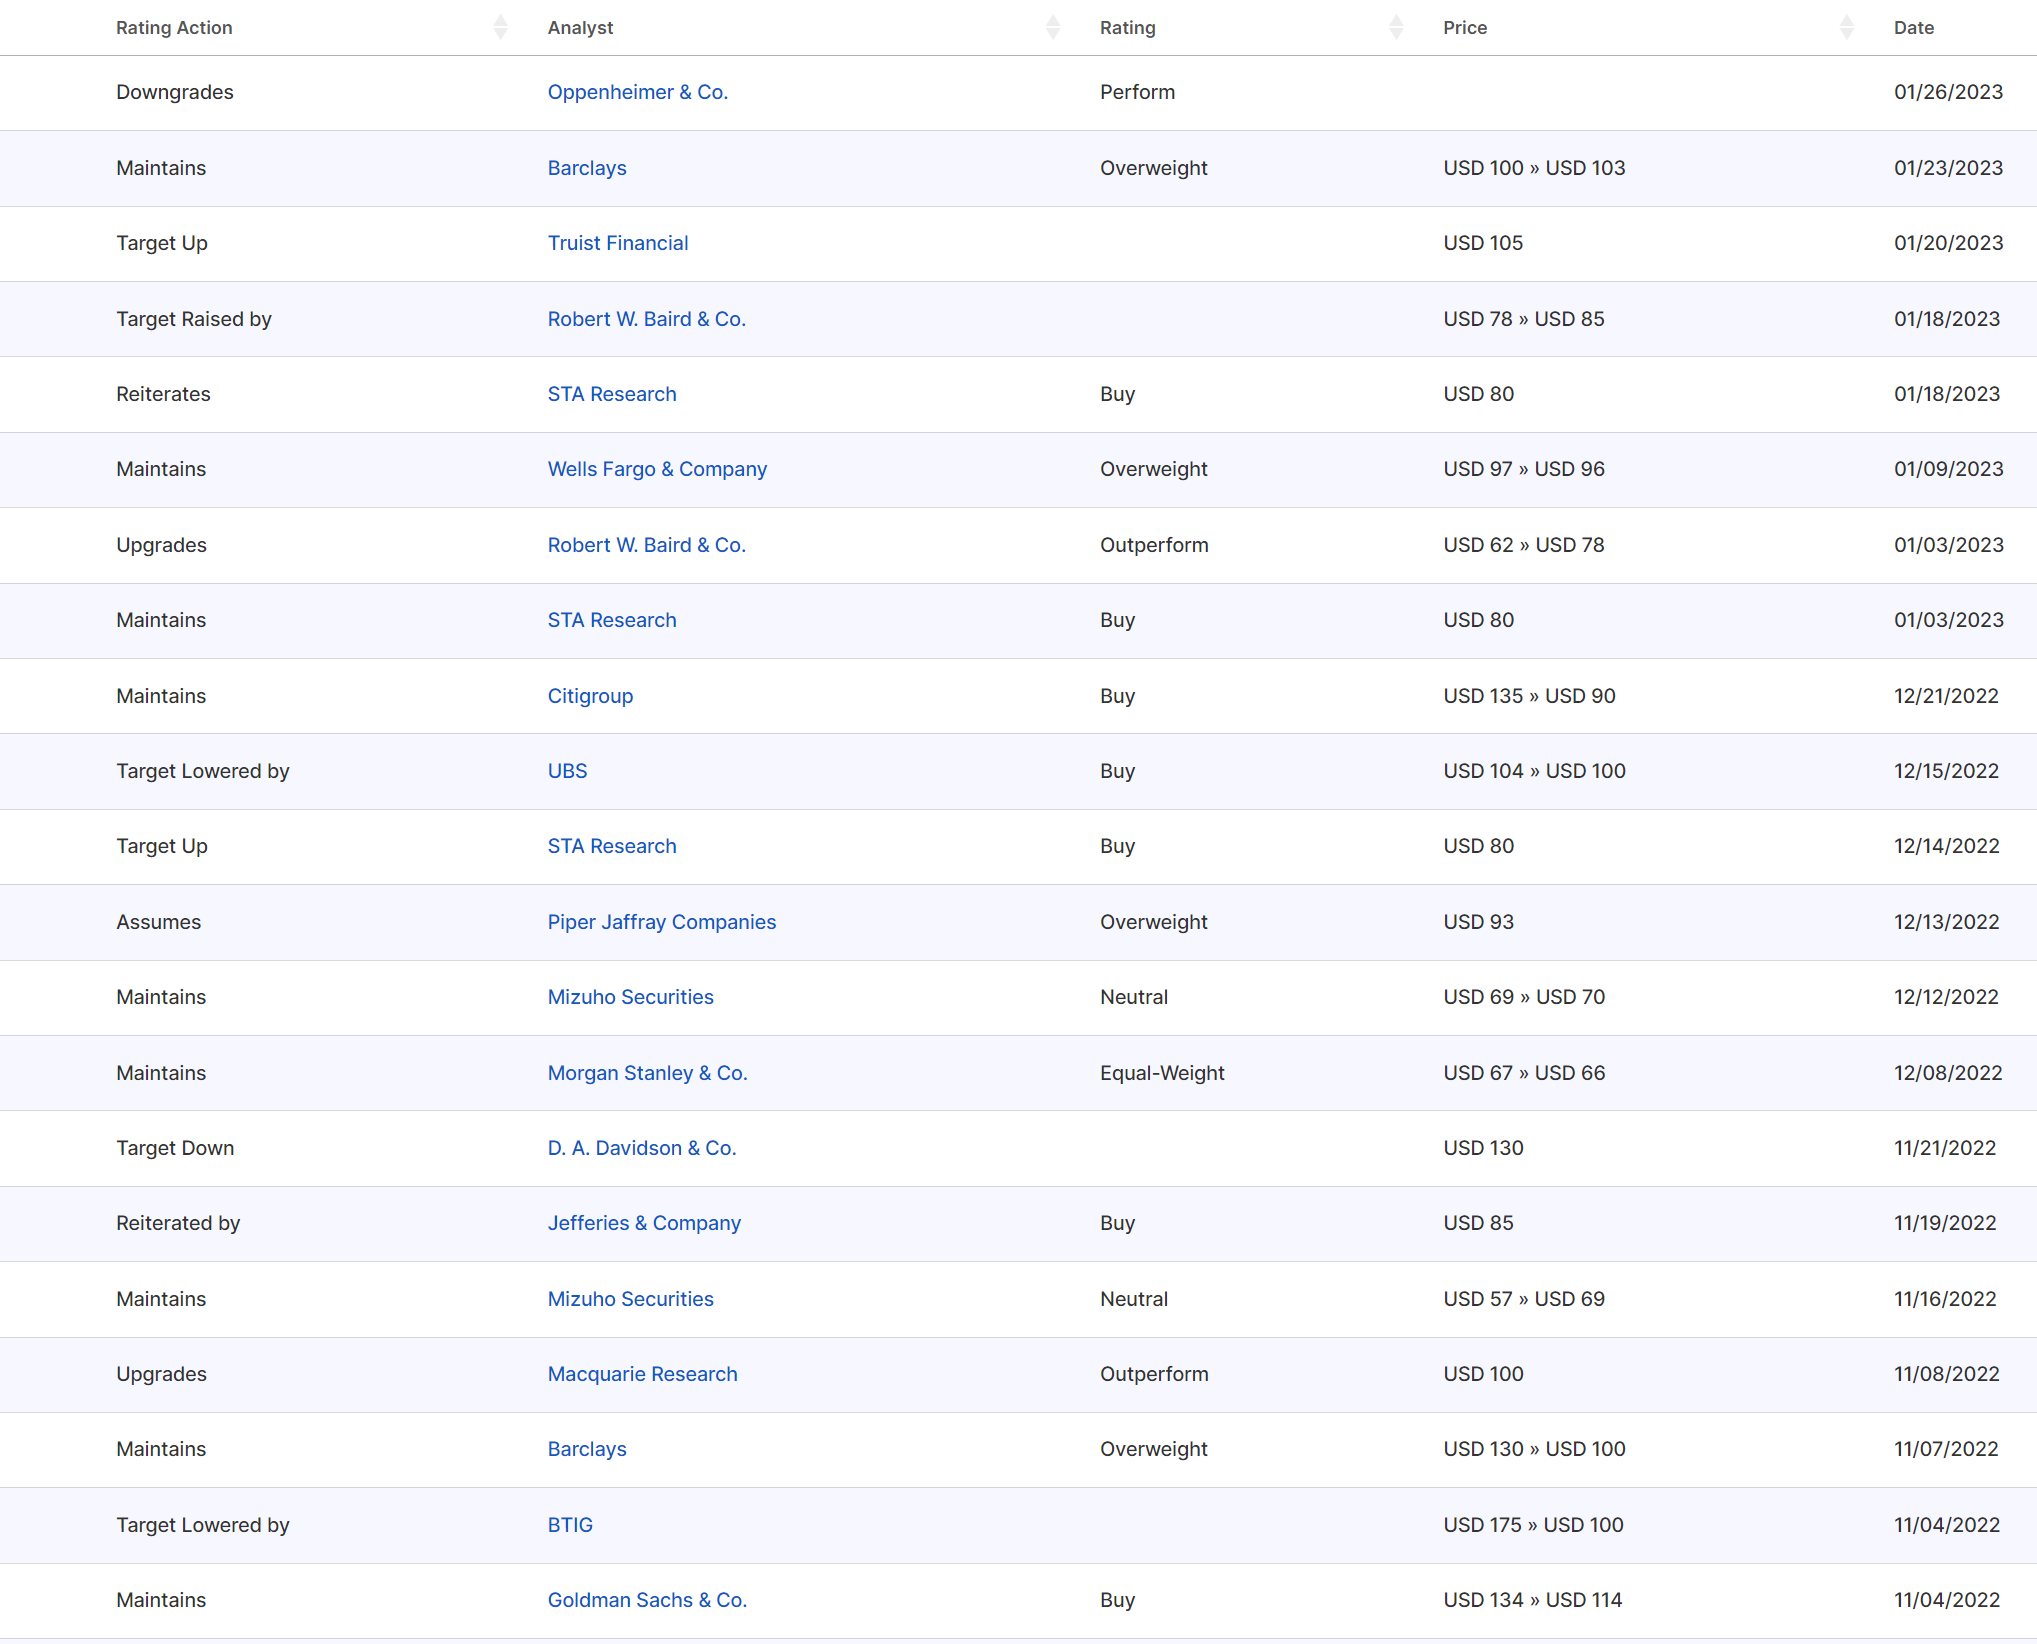
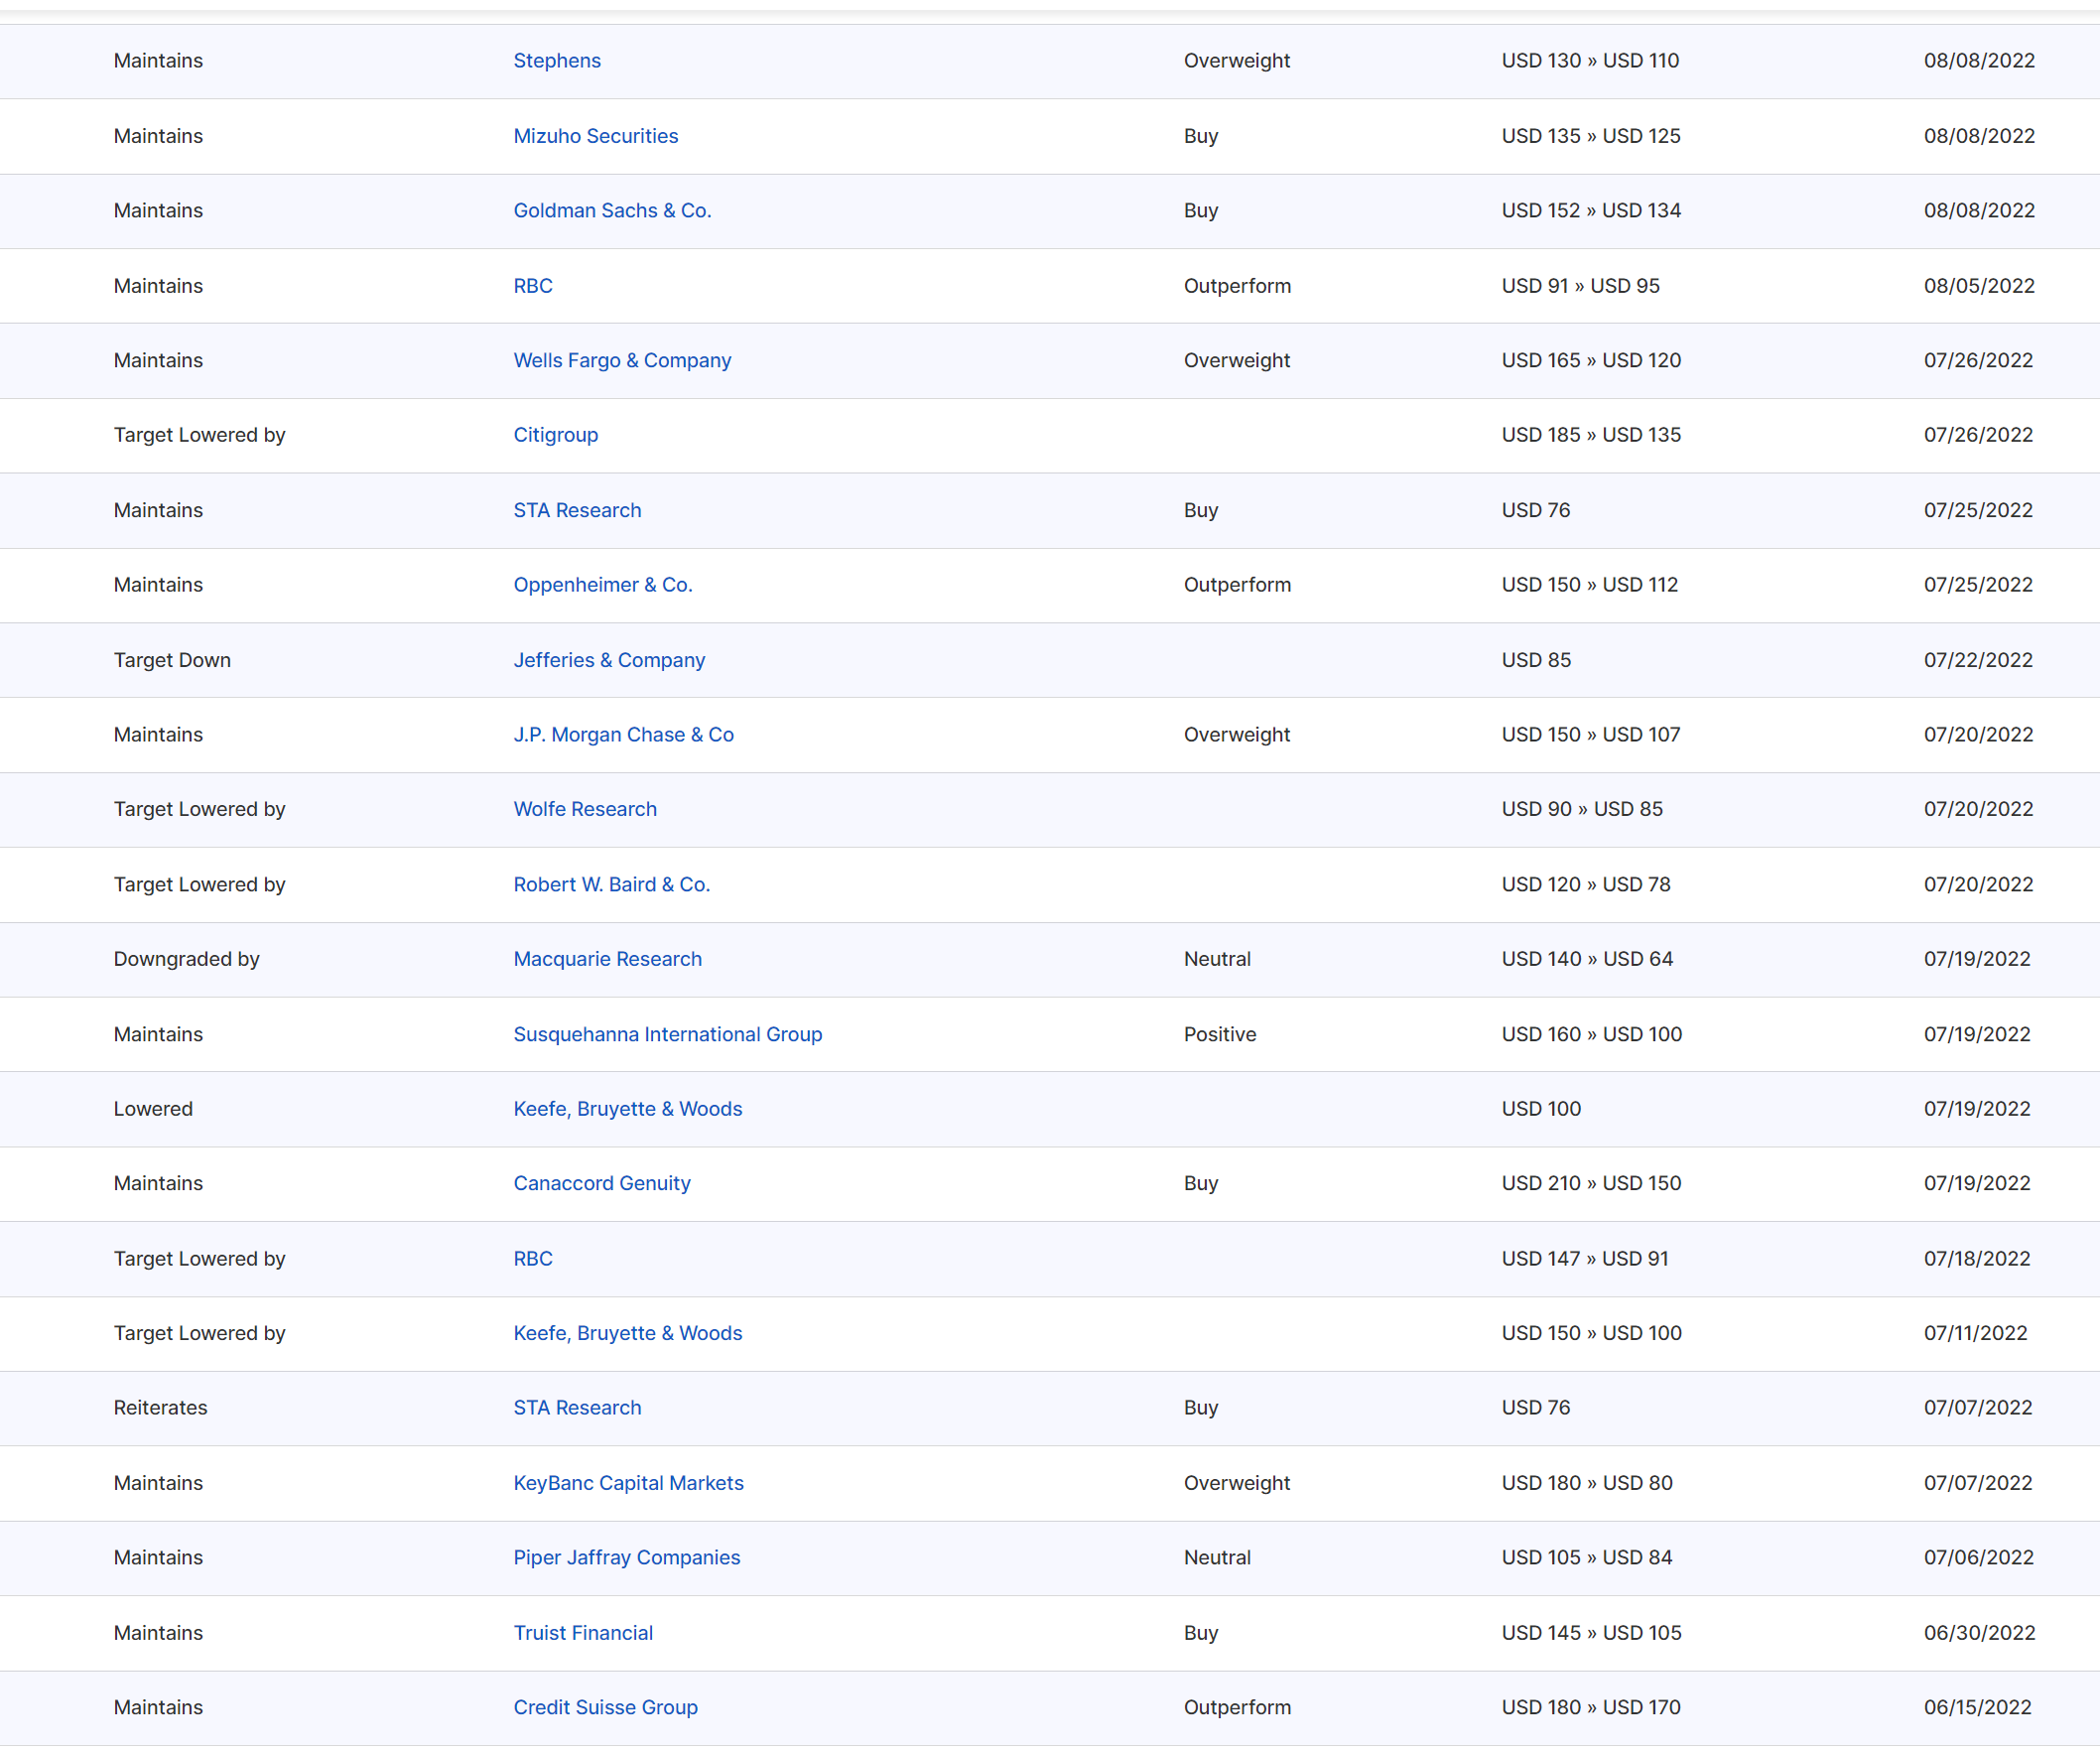
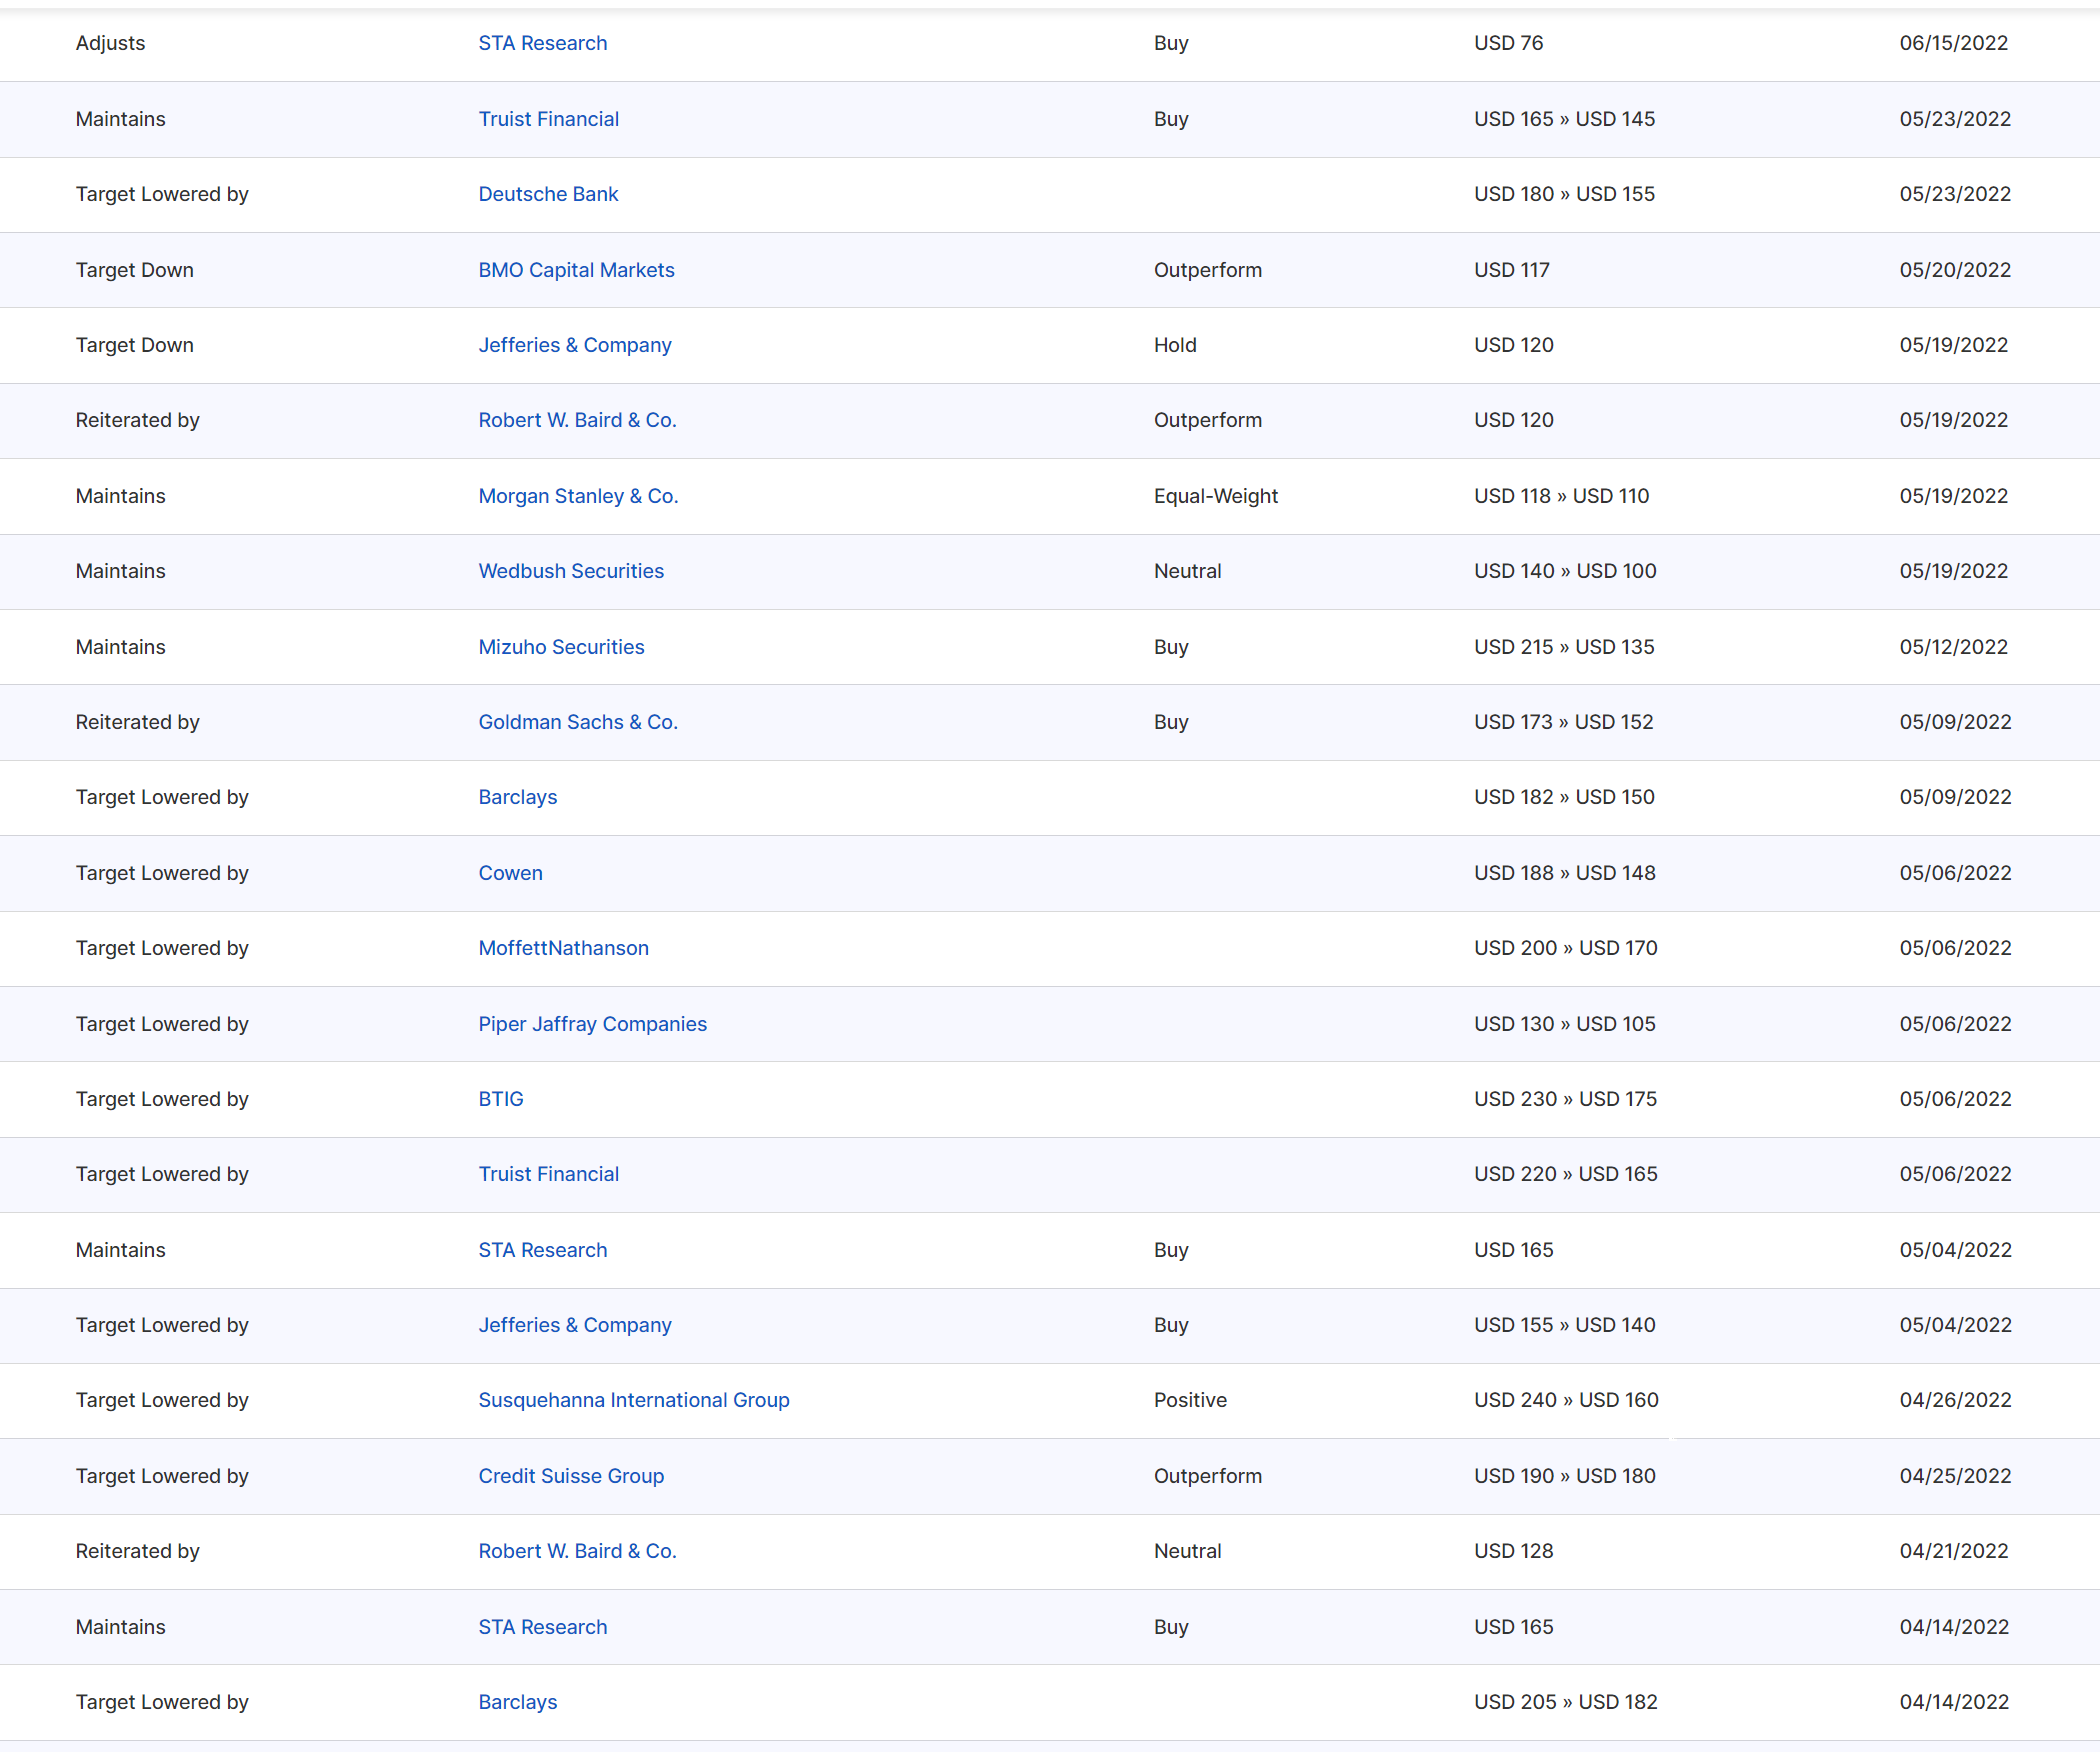
Here’s what the analysts have been saying:
January 25th: Oppenheimer analyst Dominick Gabriele downgraded Block to Perform from Outperform without a price target. The analyst cites the recent share rally and the firm's 2024 profit estimates being significantly below consensus for the downgrade. Block will be a first mover for a "risk on" trade, but financial technology stocks have not bottomed and the recent rally in the shares could "evaporate," the analyst tells investors in a research note. The firm's below-Street estimates stem from a spending slowdown in seller combined with less Cash App monthly active adds then consensus as well as less spend per active.
January 23rd: Barclays analyst Ramsey El-Assal raised the firm's price target on Block to $103 from $100 and keeps an Overweight rating on the shares ahead of the company's Q4 results. Block's hiring appears to have fallen precipitously in Q4, potentially highlighting the company's more proactive approach on profitability, the analyst tells investors in a research note. The firm believes Street estimates for gross profit seem achievable in Q4, and says engagement on Cash App, Seller and Afterpay remain solid per its channel checks.
January 20th: Truist analyst Andrew Jeffrey raised the firm's price target on Block to $105 from $85 and keeps a Buy rating on the shares as part of a broader research note on FinTech names. The analyst believes that investors should focus on relative 2022 FinTech outperformers but also contends that "a catalyst is needed" for relative 2023 outperformance and sees M&A as the most likely valuation driver. Jeffrey adds that Block's gross payment volume growth will accelerate to 32% from 22% in 2022 - above the Street's 20% forecast - as he expects consumer behavior to normalize relative to last year.
January 18th: Baird analyst David Koning raised the firm's price target on Block to $85 from $78 and keeps an Outperform rating on the shares. The analyst likes the stock as it has a lot of what investors like; an above S&P-growth industry, share gains within a good industry, net cash, and it is already profitable with potential for big margin expansion.
January 3rd: Baird analyst David Koning upgraded Block to Outperform from Neutral with a price target of $78, up from $62. Block is a "premier large-cap growth franchise with both profitability and net cash," Koning tells investors in a research note. The analyst believes the company will benefit from macro trends such as rising interest rates and inflation. After the shares declined down 61% in 2022, the analyst thinks sentiment can improve as Block's growth "should remain good in 2023 and margins ramp."
December 21st: Citi analyst Peter Christiansen lowered the firm's price target on Block to $90 from $135 and keeps a Buy rating on the shares. The analyst believes Block, "now at all-time lows" on an enterprise value to EBITDA basis, "represents a compelling buying opportunity," Christiansen tells investors in a research note. Key to 2023 will be efficiency gains, tighter discretionary spend, and slower hiring, which has already resulted in 20%-25% expense reduction in the last two quarters, says the analyst.
December 13th: Piper Sandler analyst Kevin Barker assumed coverage of Block with an Overweight rating and $93 price target. Block is "very well positioned" to generate consistent revenue and earnings growth over the next several years due to increasing subscription-based revenue growth from Square customers, Barker tells investors in a research note. In addition, the company is enjoying "outsized" gross profit growth from Cash App as users increasingly utilize the app's instant transfer capabilities, says the analyst.
December 12th: Mizuho analyst Dan Dolev raised the firm's price target on Block (SQ) to $70 from $69 and keeps a Neutral rating on the shares as part of the firm's FinTech & Payments team providing its 2023 outlook for sub-sectors in the group against a backdrop of higher rates, high inflation, and a slowing macro. The group's top picks include Fiserv, Toast (TOST), FIS (FIS) and Robinhood (HOOD), while they are cautious on Upstart (UPST), Coinbase (COIN) and Block.
December 8th: Morgan Stanley analyst James Faucette lowered the firm's price target on Block (SQ) to $66 from $67 and keeps an Equal Weight rating on the shares. He sees 2023 as likely a weaker environment for credit and within his payments coverage universe he expects the weakening environment to impact companies with direct credit exposure, while expecting the impact to overall consumer spending to be "more nuanced and less material," Faucette tells investors. In that context, he is trimming estimates at Block, Affirm (AFRM) and NerdWallet (NRDS) to reflect weakening credit forecasts and a more difficult environment for low end consumers.
December 6th: Deutsche Bank analyst Bryan Keane says Square is heading into the new year with momentum. Even as market volatility and concerns surrounding macro headwinds have weighed on the stock, the company's fundamental trajectory is positive heading into fiscal 2023, Keane tells investors in a research note. He believes Block will continue "pulling levers" to drive margin expansion as the company increases focus on reining in spending while still investing for long-term growth. Keane sees fiscal 2023 upside potential to adjusted EBITDA margins to 21% versus his current expectations of 17%. He reiterates a Buy rating on Block shares.
November 16th: Mizuho analyst Dan Dolev raised the firm's price target on Block to $69 from $57 and keeps a Neutral rating on the shares. The analyst says payday lending is increasingly meaningful to Cash App gross profit growth. Payday lending is a near-term boost to inflows, but it may ultimately pressure Block's multiple as delinquencies across consumer lending continue to rise, Dolev tells investors in a research note. This is particularly concerning given Cash App's skew towards lower-income households, says the analyst.
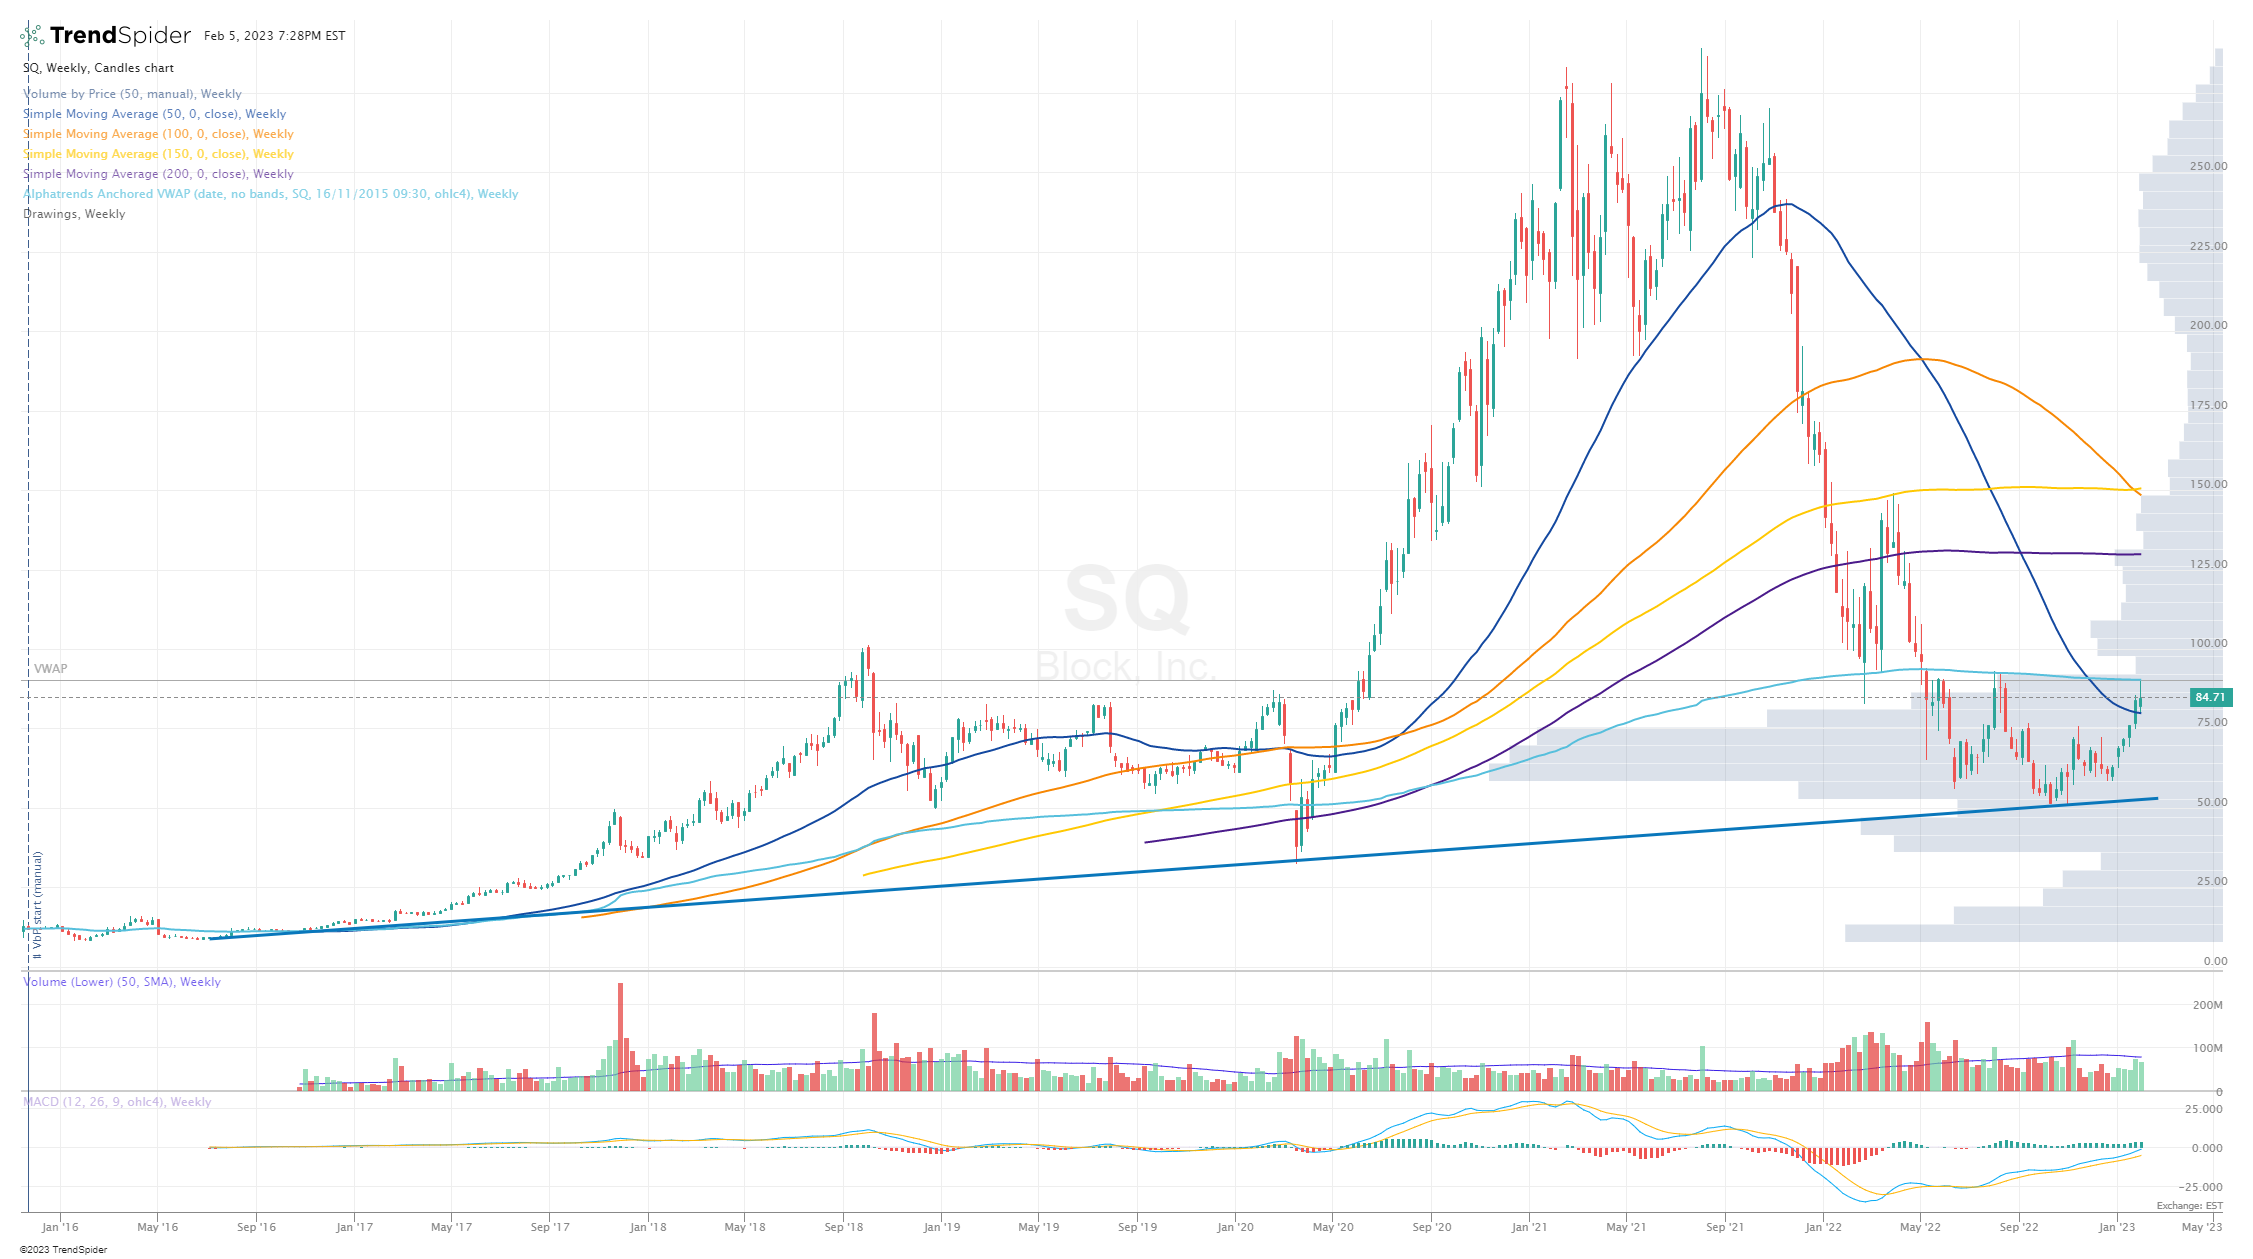
Technicals
This first chart is the weekly chart going back to the IPO in 2015 and as you can see SQ got rejected both this past week and the summer highs at the VWAP from the 2015 IPO. That’s pretty wild and not a coincidence. Not sure if that’s humans or algos but someone is watching that VWAP and hitting the sell button when SQ gets back to it.
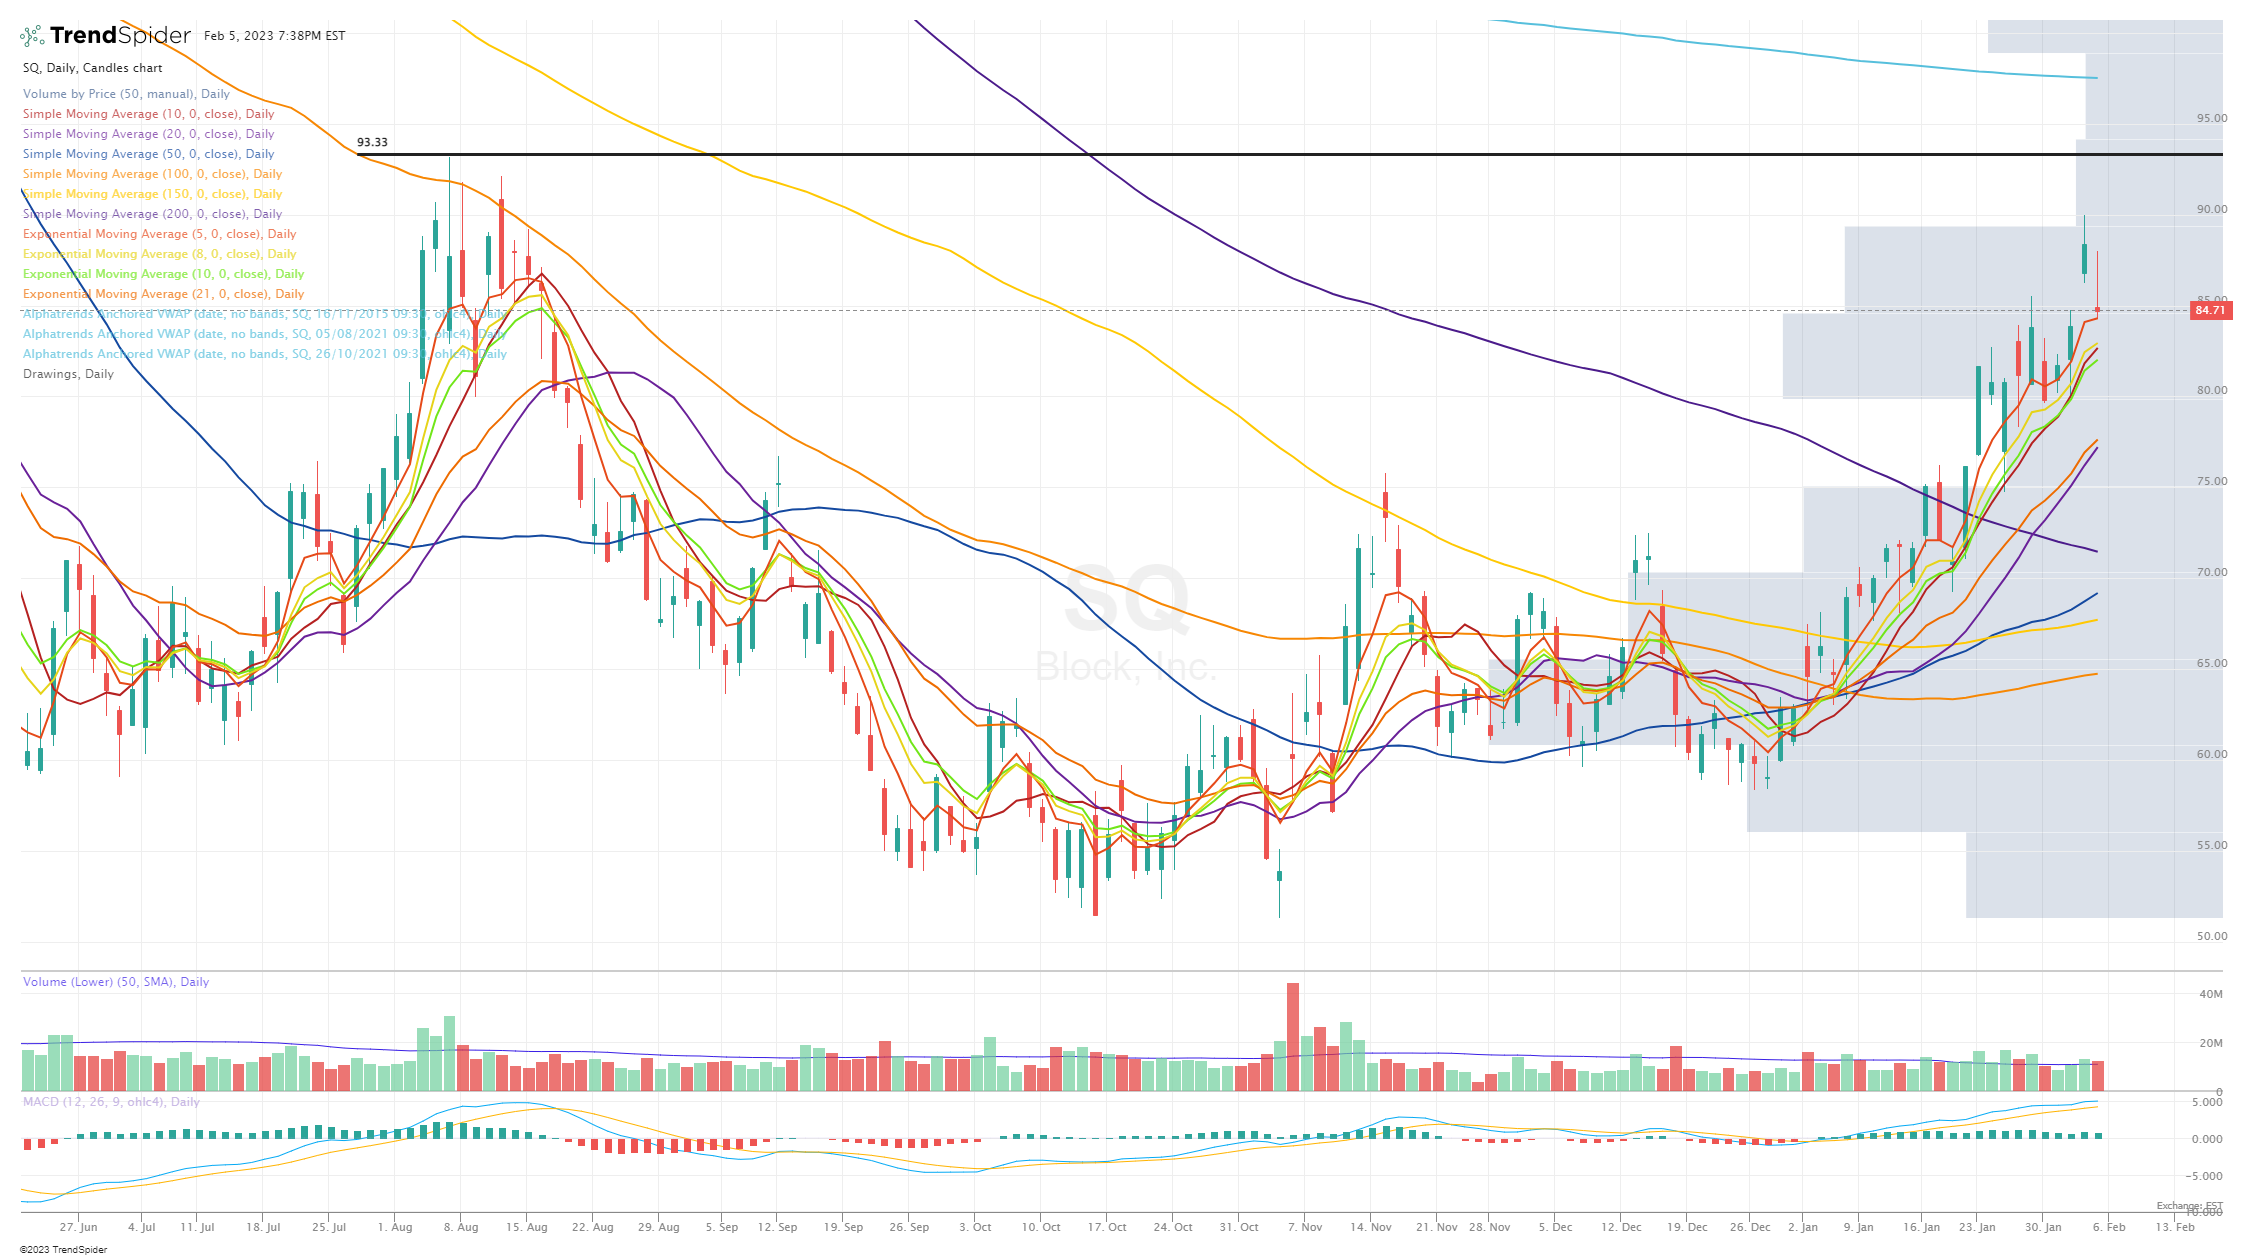
This next chart shows the VWAP from all time high — if SQ pushes through the VWAP from IPO in the next few days or few weeks I think these are the two VWAPs that could provide the next area of potential resistance. I’d say the top VWAP which goes back to the ATH will be harder to get through. Right now it’s at $108.92
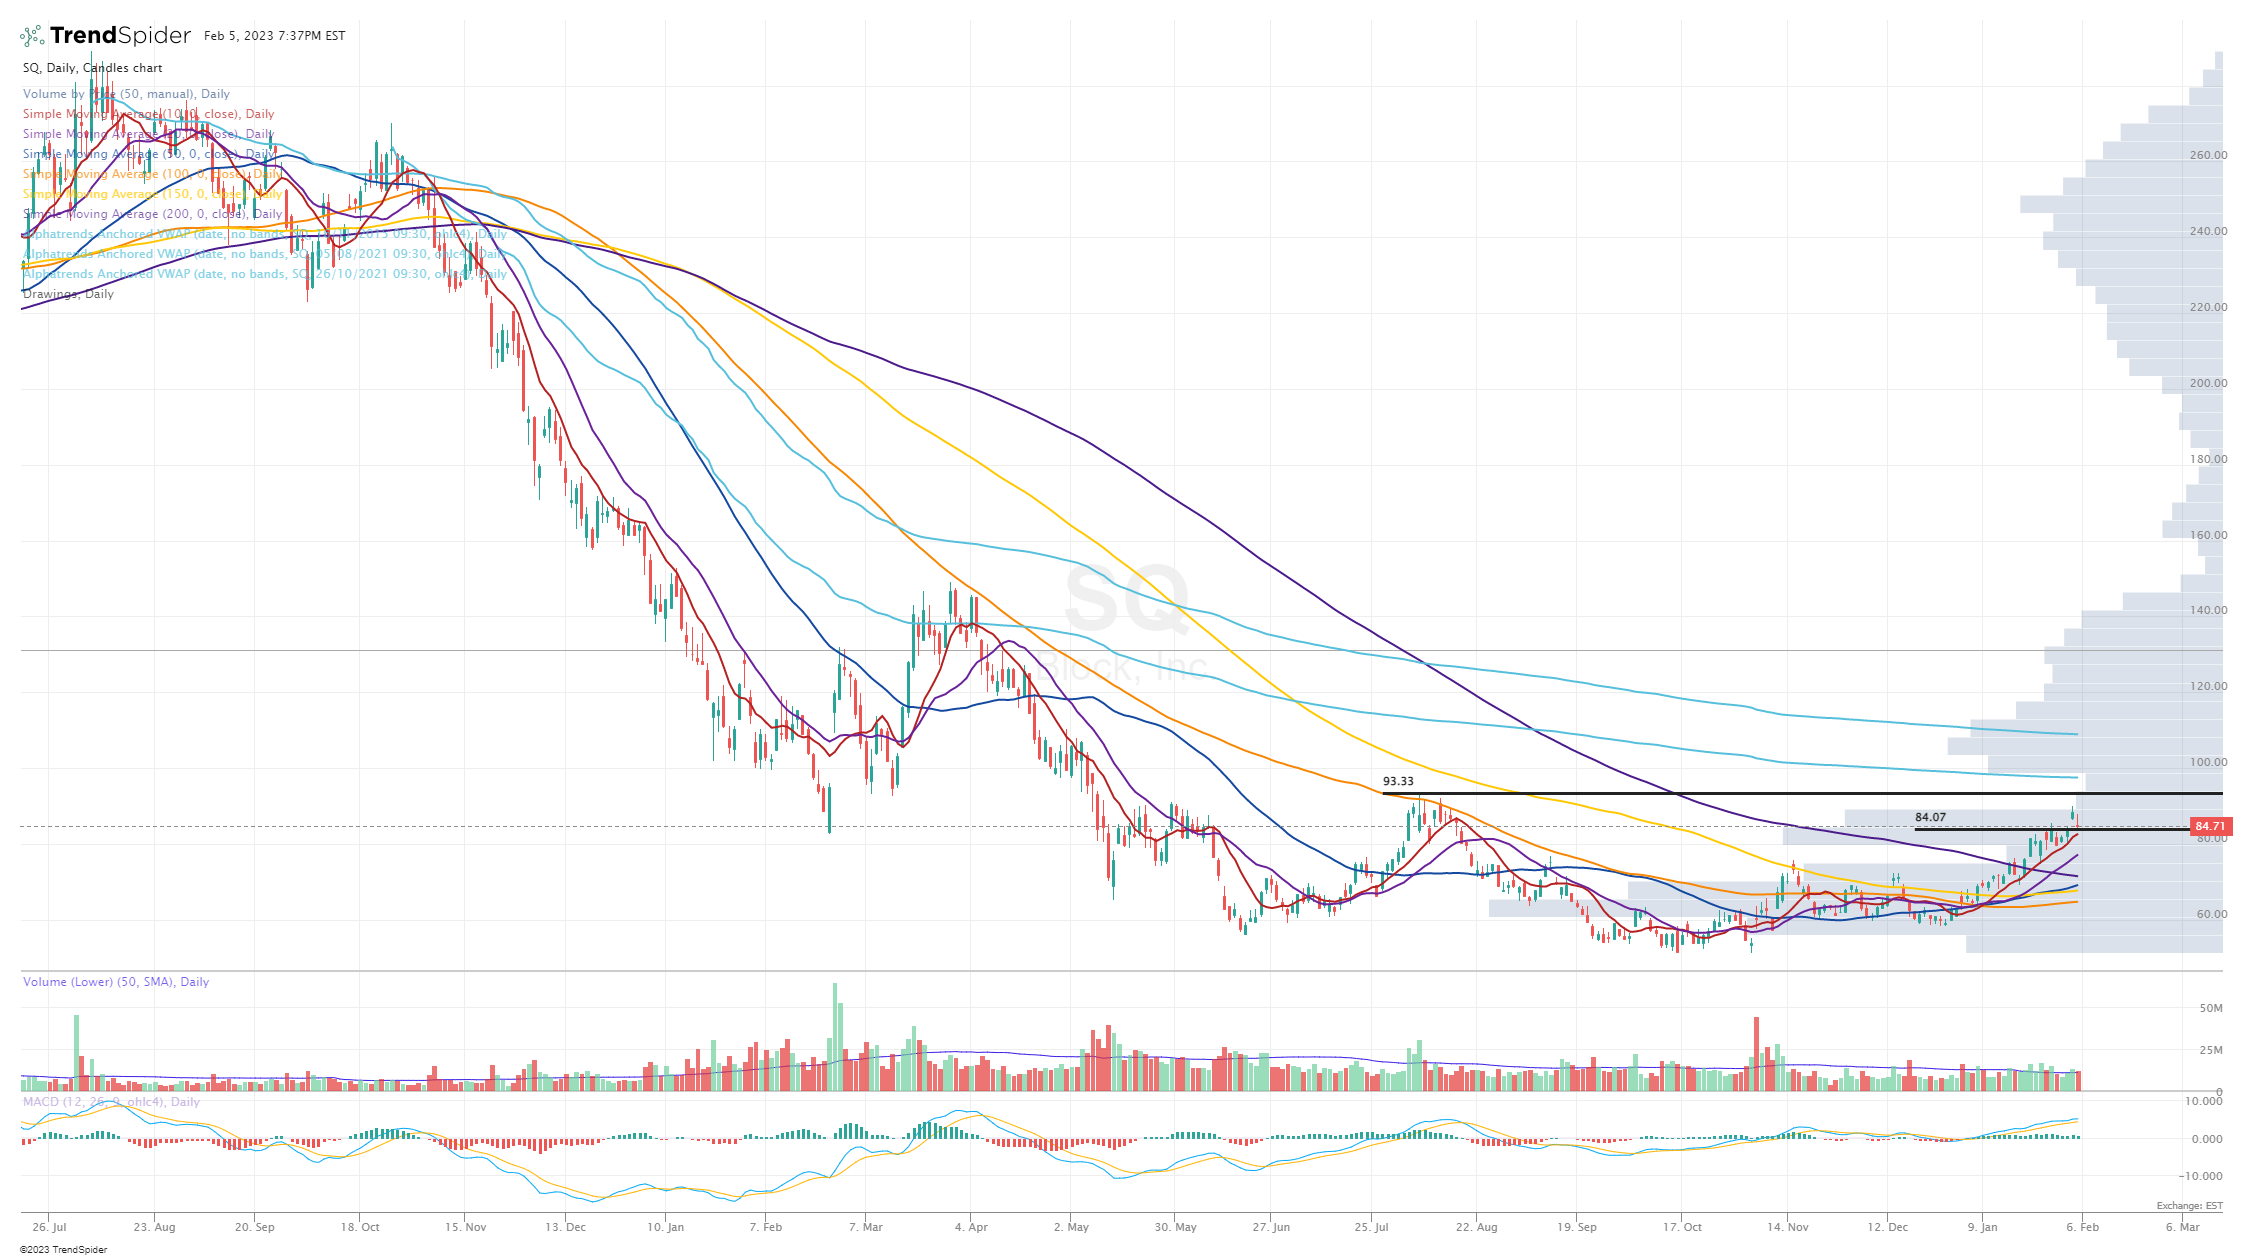
This last chart shows the recent trading patterns for SQ, breaking through the 200d sma a few weeks ago and then pulling back to the 10d ema/sma every few days on the way up. This past Friday SQ pulled back to the 5d ema, curious to see if that holds this week, if not I’m assuming SQ will pullback again to the 10d ema/sma in the $82.25 range which could be a decent place to start a position. If you’re looking to manage risk on new positions and want to very tight with your stop losses you could stick it right under the 10d ema. If you’re looking to be a little looser with your stop losses you could stick it under the 20d sma at $77.00 and perhaps even average down into the 20d sma if you were looking to keep building a bigger position while lowering your cost basis.
Conclusion
As I disclosed in the introduction, I don’t have a position in SQ right now but I’m definitely considering one. The question I need to ask myself is whether I want to do it before they report Q4 earnings on February 23rd. I think there’s a 50% chance I start a small position (approx 1.5%) in SQ if the stock pulls back to the 10d ema/sma in the next week but I’d probably have a stop loss just below my entry price because if the 10d ema/sma does not hold up then it looks like the stock might be headed to the 21d ema or 20d sma and I’d rather get back in at those levels.
Regardless of what SQ’s stock price does in the next 2-3 weeks (before & after Q4 earnings), I do think this stock is going to be a winner over the next 3-4 years assuming they can keep growing revenues at close to 20% per year while tripling net income margins from 4% to 12% which means 40-60% net income growth leading to a pretty decent P/E multiple. I did own SQ back in 2020 and early 2021; now with the stock still down more than 70% from the ATH and the underlying business stronger than ever with lots of levers to pull for growth and profits, I think SQ is one of those stocks you need to keep a close eye on. I’m curious to see what kinds of contributions CashApp and Afterpay add to the top/bottom line financials over the next few years. Both of which are very important to the future success of SQ and will have a big impact on shareholder returns.
Hope you enjoyed Part 2 of the Block/Square deep dive writeup. Let me know if you have any questions or thoughts about the company.
Have a great week,
Jonah Lupton
PS: don’t forget to check out my other Substack at tradingcharts.luptoncapital.com and my Stocktwits room [click here].
Disclaimer: The stocks mentioned in this newsletter are not intended to be construed as buy recommendations and should not be interpreted as investment advice. Many of the stocks mentioned in my newsletter have smaller market capitalizations and therefore can be more volatile and should be considered more risky. I encourage everyone to do their own research and due diligence before buying any stocks mentioned in my newsletters. Please manage your portfolio and position sizes in accordance with your own risk tolerance and investment objectives.